

Before we jump into the nuts and bolts of the setup, let’s talk about why you’re here in the first place. Getting your hands on real-time OTC quotes isn't just a minor upgrade; it’s a fundamental shift in how you can approach the Over-The-Counter market. In a decentralized world where solid, timely information is gold, real-time data is your competitive edge.
The Overlooked Advantage: Real-Time OTC Data
Unlike the big boards like the NYSE or NASDAQ, the OTC market is a scattered landscape. There's no central hub, which means price and volume information can be fragmented, slow, and inconsistent. For any serious trader, that delay isn't just an annoyance—it's a direct threat to your bottom line. Trading on old information is a surefire way to miss the boat or, worse, get stuck in a bad position.
When you have real-time data streaming in, you stop reacting to the market and start anticipating it. You can see momentum building, spot unusual volume spikes, and catch potential breakouts the moment they begin, not 15 minutes after the fact. This is especially critical in the often-illiquid OTC space, where even small trades can swing prices dramatically.
Why Every Second Matters
In OTC trading, a few minutes can feel like an eternity. That small delay between what’s happening and what you see is often the difference between a clean profit and a frustrating loss. Real-time data feeds strip away that ambiguity, giving you a crystal-clear picture of what’s happening right now.
This immediate insight lets you:
- Trade with Conviction: Pull the trigger on trades with confidence, knowing your information is current and accurate.
- Sharpen Your Risk Management: Set stop-losses and take-profit targets that reflect live market conditions, not yesterday's action.
- Find Hidden Gems: Uncover arbitrage plays or catch the beginning of a trend that traders with delayed feeds will miss entirely.
The real takeaway is this: you get to see the market as it is, not as it was. This clarity is the foundation for any effective strategy, whether you're day trading penny stocks or analyzing bigger, thinly-traded companies.
To truly grasp the difference, let’s compare the two side-by-side. For an active trader, the distinction is night and day.
Key Advantages of Real-Time vs Delayed OTC Data
| Trading Aspect | Impact with Real-Time Data | Limitation with Delayed Data |
|---|---|---|
| Entry & Exit Points | Execute trades at the current market price with precision. | Risk of slippage; entering or exiting at a worse price than intended. |
| Momentum Trading | Identify and act on breakouts and volume surges as they happen. | Chasing moves that have already happened, leading to poor entries. |
| Risk Management | Set accurate stop-losses based on live volatility and price action. | Stop-losses might trigger on old data or fail to protect against rapid drops. |
| Opportunity Spotting | Uncover arbitrage or early trend formations before the broader market. | Completely miss short-lived opportunities that rely on speed. |
Ultimately, relying on delayed data is like trying to drive while looking in the rearview mirror. You can see where you've been, but you have no idea what's coming.
A Quick Look at the Data in Action
Having real-time OTC quotes is crucial for anyone trading securities off the major exchanges. For example, if you were watching a stock like Open Text and saw its price was $38.95, but also saw it had a live daily change of -0.84%, you could react instantly. This kind of live pricing, detailed on platforms like TradingEconomics.com, allows you to make decisions based on immediate market sentiment.
Integrating a tool that delivers this data instantly is non-negotiable for a serious OTC trading strategy. To dig deeper into trading techniques and market analysis, feel free to explore the resources on our OTC Charts MT4 blog.
Getting Your MT4 Platform Ready for OTC Charts

Before we can plug in our OTC charts and start analyzing real time otc quotes, we need to make sure your MetaTrader 4 platform is properly set up. Taking a few minutes to get the foundation right will prevent most of the common snags traders run into down the line.
Think of it as setting up your workshop before starting a big project. You wouldn't just start cutting wood on an unstable table, right? The same logic applies here. A clean, correctly configured MT4 terminal is the key to making sure the OTC Charts tool runs smoothly.
From a hardware perspective, you don't need a high-end gaming rig. A modern PC running Windows 10 or later with at least 4GB of RAM and a steady internet connection is more than enough to handle the data stream without any frustrating lags or freezes.
Checking Your MT4 Build and Broker Permissions
I've seen it countless times: the number one reason for installation headaches is either an outdated MT4 build or a broker that restricts what you can do. MetaQuotes, the company behind MT4, pushes out updates regularly, and our OTC charting tool is built to work with the latest platform releases.
First, let's check your version. Inside your MT4 terminal, just click Help > About. A small window will appear with all the details. You're looking for build 1350 or higher. Anything older than that is likely to cause compatibility problems.
Next, and just as important, is confirming your broker allows you to use third-party tools, often called Expert Advisors (EAs). Some brokers lock this down. The quickest way to check is to look for the "AutoTrading" button in your main toolbar. If you can click it and it turns green, you're almost certainly in the clear. If you have any doubts, firing off a quick email to your broker's support team is the best way to get a solid answer.
My Personal Tip: I always recommend creating a separate MT4 profile just for OTC trading. Go to File > Profiles > Save As and name it something like "OTC Analysis." This keeps your OTC charts completely separate from your regular forex indicators and workspaces. It's a simple trick that massively reduces clutter and helps you stay focused.
Your Quick Pre-Installation Checklist
Let's run through a final check before we proceed. Ticking these boxes now will all but guarantee a smooth setup.
- Platform Version: Is your MT4 build 1350 or newer?
- Expert Advisors: Have you confirmed your broker permits third-party EAs?
- Internet Connection: Is your connection stable enough for a live data feed?
- Dedicated Profile: Did you create a clean profile just for OTC trading?
Once you've got these small but critical details sorted out, your MT4 environment is primed and ready. You've now built the perfect foundation to unlock the full power of real-time OTC quotes.
Getting OTC Charts Installed and Activated on MT4
Alright, with your MetaTrader 4 platform ready to go, it’s time for the fun part. We're going to walk through installing the OTC Charts software, getting it activated, and pulling up your first live chart. It's a pretty painless process once you know where everything goes.
Our goal is to turn your standard MT4 terminal into a specialized powerhouse for analyzing real-time OTC quotes. We’ll start by dropping the files into the right folders and then configure the settings that bring the data feed to life.
Finding the Right MT4 Folder
First things first, you'll need the OTC Charts installation files you downloaded. Inside that ZIP file, you'll find two crucial components: an Expert Advisor (EA) file ending in .ex4 and an indicator file, which also has an .ex4 extension. They work as a team.
To get them installed, we need to place them in specific subfolders inside your MT4 data directory. It's easier than it sounds.
- From your MT4 platform, click File in the top-left corner.
- From the dropdown, select Open Data Folder. A file explorer window will pop right up, showing you the backend of your MT4 installation.
- Double-click to open the MQL4 folder. This is the home for all your custom indicators and EAs.
Now, it's just a matter of copy and paste:
- Take the OTC Charts EA file (
.ex4) and drop it into theMQL4\Expertsfolder. - Next, copy the OTC Charts Indicator file (
.ex4) and paste it into theMQL4\Indicatorsfolder.
Once the files are in their new homes, you have to restart MT4. Just close the platform and open it again. This simple step forces MT4 to scan for the new files you just added.
Activating and Configuring the EA
With the files in place, you’re ready to bring the tool to life on a chart. Go ahead and open a clean chart for any instrument—it doesn't matter which one. Think of it as just a blank canvas for the EA to work on.
Now, look over to the Navigator panel, usually on the left side of your MT4 screen. If you expand the "Expert Advisors" section, you should see "OTC Charts" in the list. Simply drag it from the Navigator and drop it onto your chart. A settings window will appear instantly.
This settings pop-up is your mission control. Don't just click "OK" and hope for the best. Taking a moment to get these settings right is the key to getting accurate, timely data. The two most important fields are your license key and the data provider.
The image below gives you a good idea of how the data flows from various sources, gets processed, and is finally delivered to your screen.
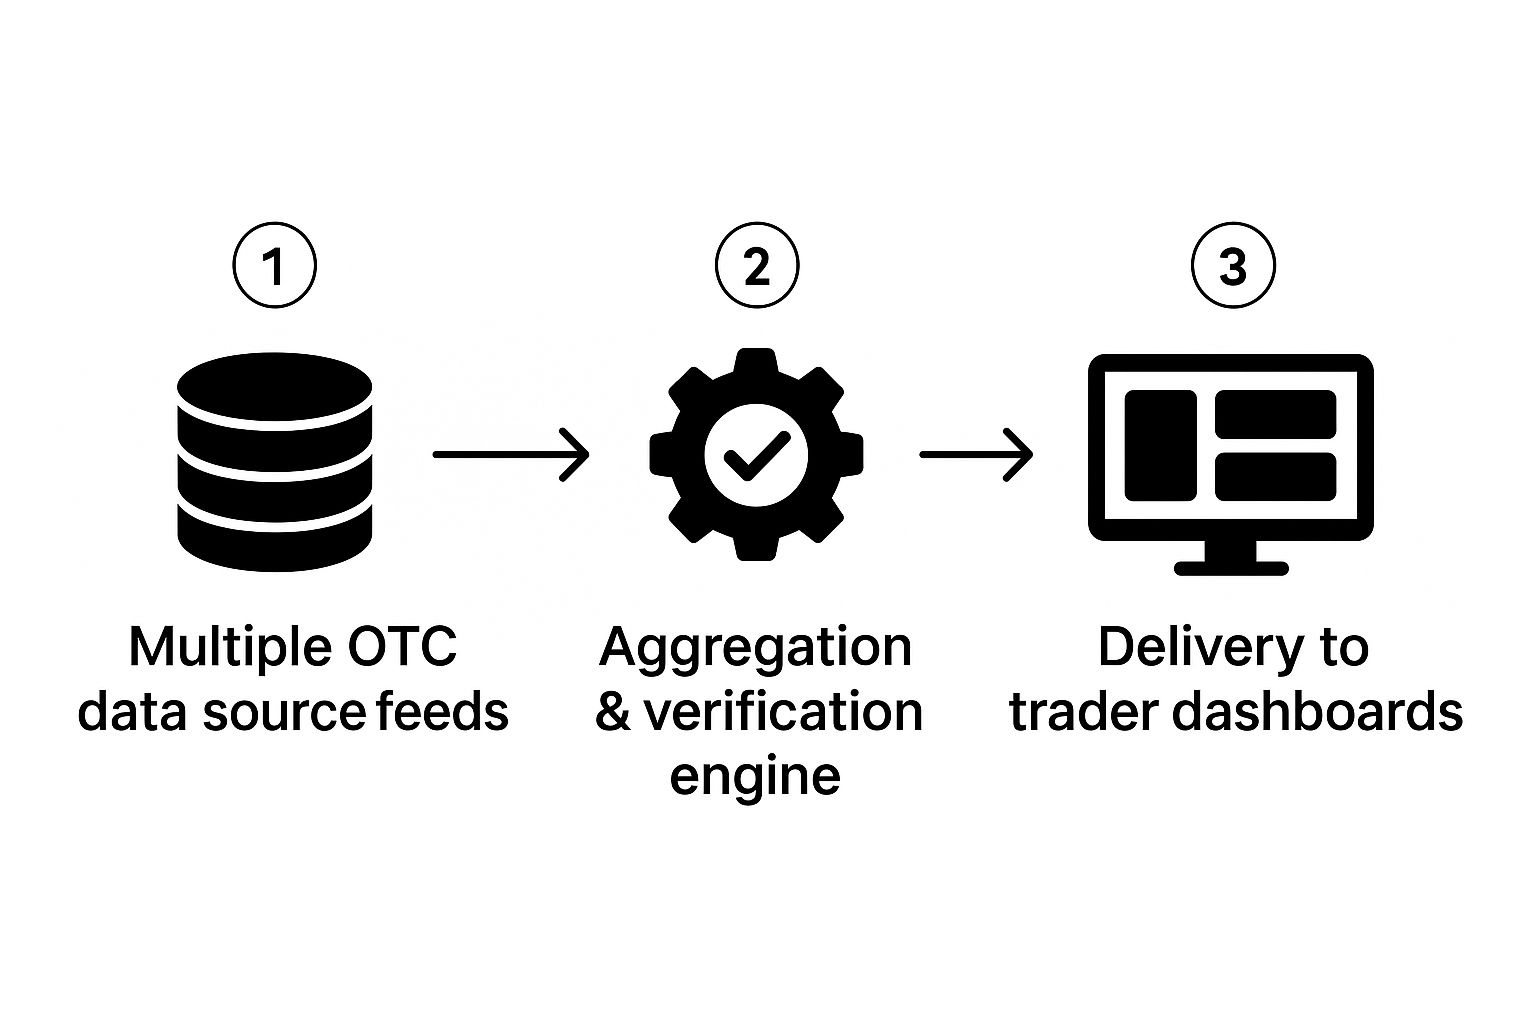
This whole process really underscores why a solid aggregation engine is so important for ensuring the real-time OTC quotes you're seeing are both reliable and verified.
Back in the settings window, click on the "Inputs" tab. This is where you'll enter the unique license key you received. This key is what activates your subscription and connects you to the live data feed. If you're still weighing your options or need help, you can check out the available services from OTC Charts MT4 to see which plan makes the most sense for your trading style.
Loading Your First OTC Stock Chart
Once your license is active, you're ready to load your first stock. In the same EA "Inputs" tab, look for a field labeled something like "Symbol" or "Ticker". This is where you'll type in the OTC ticker symbol you want to analyze.
For example, you could type in "GBTC" for the Grayscale Bitcoin Trust or "TCEHY" for Tencent Holdings.
After you've entered the symbol and clicked "OK," the EA will immediately start working its magic. It will begin fetching all the relevant data and then automatically generate a brand-new, offline chart right within your MT4 platform. This new chart is where you'll see the live price action, complete with historical data, ready for you to start your analysis.
Unlocking Chart Analysis with Real-Time Data

Now that you've got OTC Charts installed, your MT4 platform is more than just a forex terminal. It's now a specialized tool for navigating the often-tricky Over-The-Counter market. The setup is done, so the real work can begin—turning that raw data feed into actionable trading ideas.
Getting access to real-time OTC quotes is a huge step, but it's really just the first part of the puzzle. The true edge comes from applying proven technical analysis techniques to that live information. The good news is that MT4’s powerful suite of built-in indicators is now at your disposal for OTC instruments, just as it would be for any major pair or blue-chip stock.
Applying Core Indicators to Live OTC Charts
Think about the indicators you already know and trust. They're all there. You can just drag and drop them onto the custom OTC chart you’ve generated. It's surprisingly seamless.
Here’s how you might use a few of the classics in a real-world OTC scenario:
- Moving Averages (MA): I often start by throwing a 50-period and a 200-period moving average on a penny stock chart. It’s a quick and dirty way to visualize the underlying trend and spot potential support or resistance levels as they develop.
- Relative Strength Index (RSI): Next, add the RSI to get a feel for the stock's momentum. In the fast-moving OTC world, this is critical for spotting overbought or oversold conditions that could signal a reversal is coming.
- Moving Average Convergence Divergence (MACD): The MACD is perfect for confirming changes in trend strength and direction. Seeing a bullish crossover on the MACD, especially when it’s backed by a pop in real-time volume, can be a high-confidence entry signal.
These aren't just static lines on a screen. They are dynamic tools that react instantly to price changes, which can give you a massive advantage when things are moving quickly.
The Critical Role of Historical Data
While real-time data is what you need for execution, solid historical data is what hones your strategy. You have to backtest your ideas before you put real money on the line. How would your strategy have worked on this stock last month? Or last year? Answering those questions is what builds the confidence you need to pull the trigger.
The ability to scroll back in time on your chart to analyze past price action is fundamental. It lets you identify recurring patterns, validate support and resistance zones, and understand how a particular stock behaves during different market conditions.
Thankfully, getting deep historical data for OTC securities is easier than it used to be. Some providers offer daily price history going back two years for free, with even deeper data available for subscribers. Having that context is a cornerstone of building a trading plan that actually works. You can get a sense of what’s out there by looking at platforms that catalog OTC stock price history from barchart.com.
A Real-World Analysis Scenario
Let's walk through how this all comes together. Imagine you’re watching a thinly traded OTC stock, let's call it XYZ. The price has been chopping sideways in a tight range for weeks.
You start by drawing trendlines on your chart, marking that consolidation. It looks like a classic symmetrical triangle pattern is forming.
Next, you add a volume indicator. You notice something subtle: while the price is quiet, volume is drying up on the down days. That’s a great little clue that the sellers might be running out of steam.
Suddenly, you see it happen. A huge green candle smashes through the triangle's upper trendline, and it's backed by a massive volume spike that you see happening in real time.
At that exact moment, you glance at your other indicators for confirmation. Your RSI just crossed above 50, and the MACD is showing a clean bullish crossover.
If you were using delayed data, you’d learn about this breakout minutes after the fact, missing the most explosive part of the move. But with real-time OTC quotes, you saw the entire setup unfold live, giving you the chance to make a timely, well-informed entry. That’s the practical power you get when you combine live data with classic technical analysis.
Getting More From Your Setup: Advanced Tips & Troubleshooting

Once you've got the basics down, a few extra tweaks and some quick-fix knowledge can make a world of difference. Even the smoothest setup will hit a snag eventually. This is where you go from just using the tool to truly mastering it.
Let's dive into a couple of techniques I rely on to make my OTC trading more efficient. First up is setting price alerts directly on the OTC charts. This is a game-changer. Instead of being glued to your monitor, you can have MetaTrader 4 ping your phone or desktop the second a stock hits your target price. It’s hands-off monitoring at its best.
Another pro-level adjustment is to play with your data refresh rate. The default is usually fast, but a super-high refresh rate can tax your system, especially with several charts running. Try easing it back to a 2- or 3-second interval instead of 1 second. You'll barely notice the difference in data timeliness, but you might see a big improvement in your platform's performance.
When Your Charts Don't Behave
Sooner or later, you'll run into a technical glitch. It happens to everyone. The trick isn't avoiding them, but knowing how to squash them fast. Here are the usual suspects and how to handle them.
That "Waiting for Update" message is probably the most common headache. It simply means MT4 is asking for data but getting silence in return. Nine times out of ten, it’s a connection issue.
- Firewall & Antivirus: Your security software can be overprotective. Dive into your Windows Firewall or antivirus settings and make sure you create an exception for
terminal.exe(the main MT4 program). - Check the Ticker: Did you type the symbol correctly? A simple typo in the EA's settings—like
GOOGinstead ofGOOGL—is enough to break the connection. Double-check it.
What if the chart doesn't load at all, or just shows an error? The classic IT solution—"turn it off and on again"—works wonders here. Restarting MT4 forces it to rescan its files. If that fails, re-check that your .ex4 files are exactly where they should be: in the MQL4\Experts and MQL4\Indicators folders.
Here's the key takeaway: Nearly every charting problem I've ever encountered comes down to one of three things: a blocked connection, a bad symbol, or a misplaced file. If you check those three things methodically, you’ll solve 90% of your issues and get your real time otc quotes flowing again in minutes.
Fixing Finicky Indicators
Sometimes the chart itself is fine, but the indicators you apply—like a Moving Average or an RSI—act up. They might not show up or just flatline. This usually happens because the indicator is trying to pull data from the wrong place.
Remember, the OTC Chart is technically an "offline" chart generated by the EA. Your standard indicators need to be told to read their data from this chart, not the original blank one.
To fix it, open the indicator's properties. You're looking for a setting, often called "Apply to," that controls its data source. Change it from the default "Close" or "Open" to "First Indicator's Data." This simple switch tells the indicator to analyze the price data from your OTC chart, ensuring your analysis is spot on.
Common Questions We Hear About OTC Quotes and MT4
It's natural to have a few questions, especially when you're integrating something new into a familiar platform like MT4. Let's walk through some of the most common things traders ask us.
So, Where Does This Data Actually Come From?
This is probably the number one question we get. The OTC market is decentralized, which means there isn't one single exchange spitting out prices. Instead, data has to be collected from many different sources.
The process involves gathering and compiling real-time data from sell-side desks that handle various asset classes. Think of it as a collaborative effort. Major financial data providers, like the London Stock Exchange Group, then make this contributed data available through specialized feeds. You can get a sense of the backend infrastructure by reading about OTC real-time data from LSEG.com. Our tool taps into these feeds to bring those up-to-the-second prices right into your MT4 terminal.
Do I Have to Use MT4 for This?
While there are other platforms out there, MetaTrader 4 is still a crowd favorite for a reason. Its strength lies in its incredible flexibility and its ability to run custom tools and Expert Advisors (EAs), like our OTC Charts indicator.
Many traders already know MT4 like the back of their hand, which eliminates a steep learning curve. When you combine its powerful charting tools with a dedicated feed for real time otc quotes, you're essentially building a professional-grade setup without the enterprise-level cost or complexity.
Will This Live Feed Slow Down My Computer?
Concerns about performance are completely valid. The good news is, you shouldn't notice a significant slowdown. We designed our tool to be lightweight and efficient.
As we covered earlier in the troubleshooting guide, you have control. You can adjust the data refresh rate to find the perfect balance between real-time updates and your own computer's resources.
The real goal isn't just about speed—it's about reliability. Having a stable, accurate data feed is what gives you the confidence to trust what you see on the screen and make solid trading decisions. That's the foundation of it all.
What Instruments Can I Actually Chart?
Traders are always curious about the scope of assets they can analyze. While we focus on delivering the most accurate data for the most popular OTC instruments, we are constantly working to expand our coverage.
The best way to see what's currently available is to check the complete, up-to-date overview on our list of services at OTC Charts MT4. That page will always have the latest information on supported symbols.
Ready to trade with professional-grade data? OTC Charts MT4 provides the real-time, reliable quotes you need to gain an edge. Visit https://otc-charts-mt4.com to get started.