
When you hear about trading, you probably picture the hustle and bustle of a major stock exchange. But there's a whole other world out there: the Over-the-Counter (OTC) market. This is where you can trade financial instruments—like unlisted stocks or certain currency pairs—directly between two parties, bypassing a central exchange altogether.
This decentralized setup unlocks some interesting possibilities, like the chance to trade on weekends, but it also brings its own set of challenges and requires the right tools for a clear view of the action.
Getting to Grips with the OTC Trading Landscape
Before you even think about placing a trade, you need to wrap your head around what makes OTC markets so different. Forget what you know about the New York Stock Exchange (NYSE) or NASDAQ. In the OTC world, there's no central hub. Instead, it’s a vast network where dealers and brokers negotiate prices directly with one another.
This creates a marketplace that is incredibly flexible but also quite fragmented. It’s where you'll find many smaller or up-and-coming companies that don't yet meet the strict listing requirements of the big exchanges. For a trader, that can mean an environment buzzing with speculative potential.
What Can You Actually Trade Here?
You might be surprised by the variety of assets available on OTC markets. While it's famous for "penny stocks," the ecosystem is much richer than that.
Here’s a quick rundown of what you’ll typically find:
- Unlisted Equities: These are company stocks not found on major exchanges. They are often sorted into tiers like OTCQX, OTCQB, and Pink Sheets, which signal different levels of financial reporting and transparency.
- Bonds and Debt Securities: A huge chunk of all bond trading happens over the counter, away from the public eye.
- Derivatives: Complex instruments like swaps and forwards are almost exclusively traded OTC.
- Weekend Forex Pairs: Some brokers provide access to specific currency pairs over the weekend, letting you trade outside of standard forex market hours.
This diversity is a big reason traders are drawn to the OTC space. And it’s not a small corner of the financial world, either. The daily turnover of just OTC interest rate derivatives exploded by 143% between 2016 and 2019, hitting an estimated $6.5 trillion a day. You can dig into the historical OTC market statistics yourself to see the scale.
Some people call OTC markets the "wild west," but that's not quite right. They operate with fewer regulations and less transparency than big exchanges, which is precisely why having reliable, independent data from tools like OTC Charts for MT4 is absolutely essential to your success.
OTC Markets vs Traditional Exchanges
To really succeed, you have to understand the fundamental differences between OTC and traditional exchange trading. These distinctions directly impact your strategy, risk, and potential returns. It mostly comes down to how they're structured, who can get listed, and how transparent the pricing is.
The table below breaks down the key distinctions you need to know.
| Feature | OTC Markets | Traditional Exchanges (e.g., NYSE, NASDAQ) |
|---|---|---|
| Structure | Decentralized network of dealers/brokers. | Centralized location with a formal structure. |
| Listing | Minimal or no listing requirements. | Strict financial and reporting standards. |
| Transparency | Lower; pricing information is less public. | High; real-time bid/ask prices are public. |
| Liquidity | Can be very low, leading to wide spreads. | Typically high, with tight bid-ask spreads. |
| Trading Hours | Often flexible, including weekends for some assets. | Fixed hours (e.g., 9:30 AM to 4:00 PM ET). |
At the end of the day, neither market type is inherently "better"—they just serve different purposes. Traditional exchanges offer stability and transparency, while OTC markets provide flexibility and access to a wider, more speculative range of assets. Knowing where you're trading is the first step to developing a winning strategy.
How to Install and Configure OTC Charts on MT4
Getting a reliable data feed into your MetaTrader 4 platform is the technical backbone of any solid OTC trading strategy. While it might sound a bit geeky, installing the OTC Charts indicator is actually a pretty simple process. It really just comes down to dropping the right files into the right folders and checking a few boxes in your MT4 settings.
Once you do this, you're essentially connecting your MT4 directly to the broker's OTC data stream, turning a standard platform into a specialized tool for navigating these unique markets. First, you'll need to download the indicator files, which usually come as an .ex4 or .mq4 file.
Locating the Right MT4 Folder
Let's get that file where it needs to go.
Open your MT4 platform and head up to the main menu. Click on File, then select Open Data Folder. This is the key first step. It takes you right to the core directory where MT4 keeps all its custom goodies—indicators, profiles, and templates. Every broker's MT4 installation creates its own unique data folder, so using this method cuts out any guesswork.
Inside that Data Folder, you'll spot a folder named MQL4. Double-click to open it. This is the engine room for all custom tools. Now, find and open the Indicators subfolder. This is the final destination. Just drag and drop your downloaded OTC Charts file right into this folder.
To get MT4 to recognize the new tool, you'll need to give it a quick refresh. The simplest way is to just close and restart the MT4 application. If you'd rather not restart, you can also right-click on "Indicators" in the Navigator window (usually docked on the left) and hit "Refresh." You should see your new OTC Charts indicator pop up in the list.
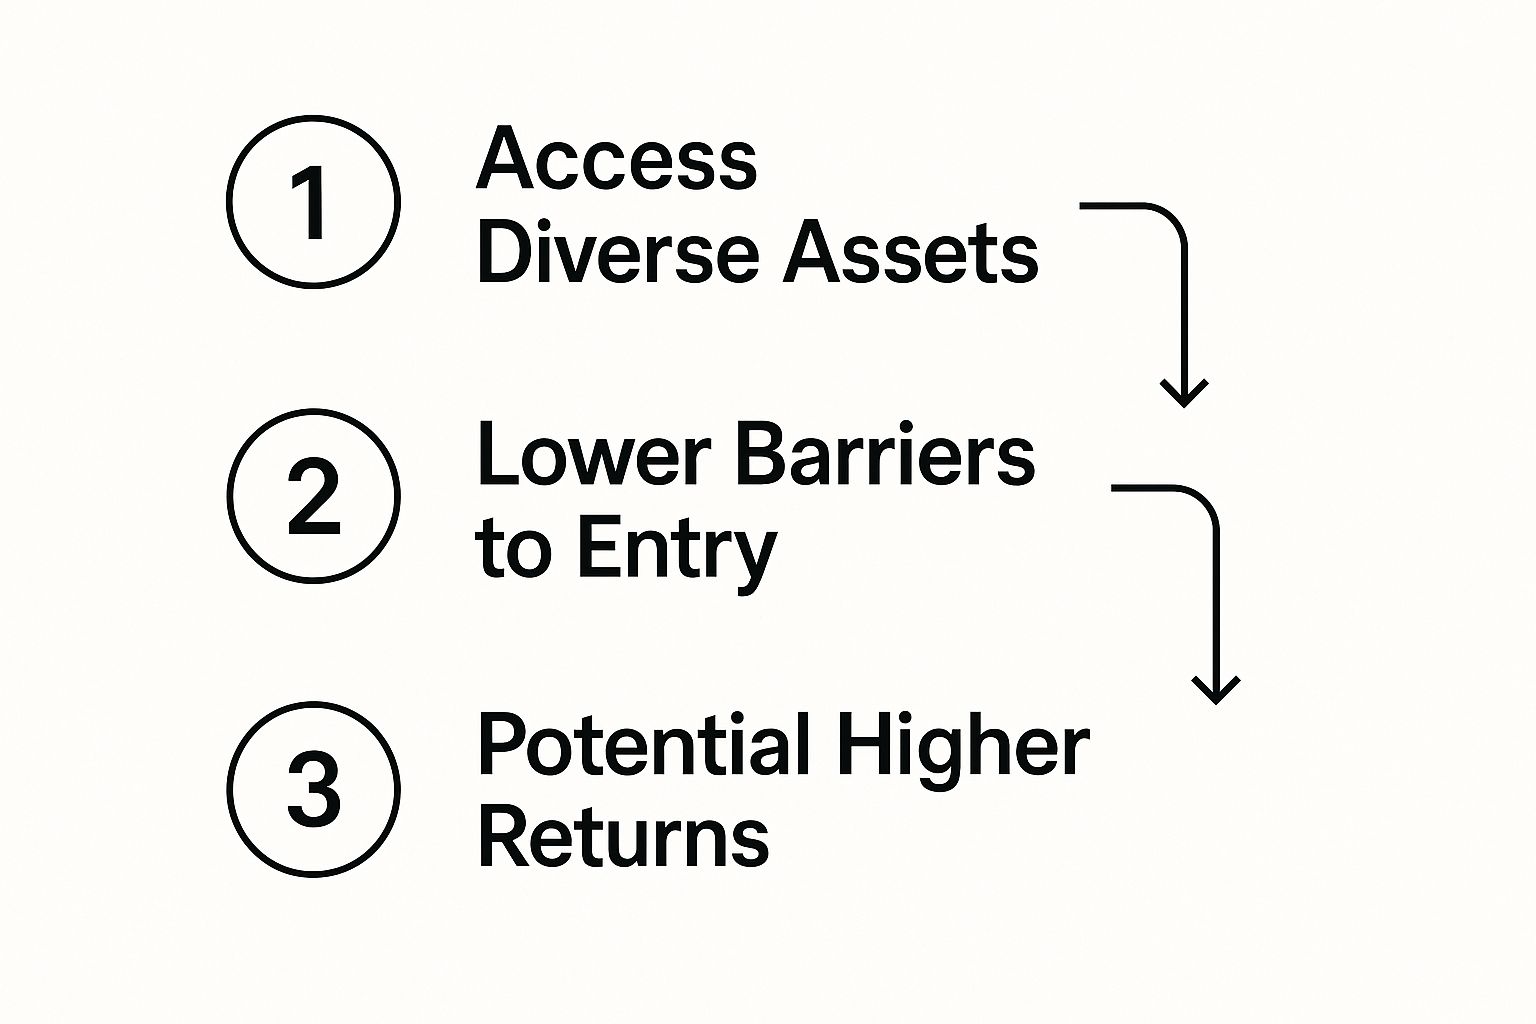
As this graphic highlights, having the right tools allows traders to tap into a wider asset pool and capitalize on opportunities that aren't available on mainstream exchanges. This is exactly what the OTC Charts indicator unlocks.
Enabling Key MT4 Settings
Okay, the file is in place. But we're not quite done. You need to give MT4 permission to run it, especially since it needs to pull in external data.
Many powerful custom indicators, including this one, rely on something called Dynamic Link Libraries (DLLs) to function. To switch this on, go to Tools > Options from the top menu and click the Expert Advisors tab.
In this window, you need to:
- Tick the box for Allow DLL imports.
- It's also a good habit to check Allow automated trading if you think you might use any expert advisors down the line.
That "Allow DLL imports" setting is critical. Without it, the indicator can't communicate with the data server, and you'll just be staring at a blank chart. From my experience, this is the single most common culprit when the setup doesn't work on the first try.
Pro Tip: When you drag the OTC Charts indicator onto a chart for the first time, a properties window will appear. Click the "Common" tab in that window and make sure "Allow DLL imports" is also checked there. This setting can be controlled for each indicator individually, so it's a good idea to confirm it's enabled.
Once these settings are locked in, you're ready for the fun part. For a more detailed look into what the data means, you can check out our guide on how to access and interpret real-time OTC quotes.
Now, just drag the indicator from the Navigator window onto your chart of choice. You should see live data start to flow, making your platform fully equipped for trading the OTC markets.
Customizing Your Charts for Smarter OTC Analysis

If you're using a default chart setup to trade OTC markets, you're leaving money on the table. It's that simple. These assets move differently, with unique speeds and behaviors that a standard MetaTrader 4 configuration just isn't built to handle. Getting an edge here means moving beyond the basics and creating an analytical environment that's built for purpose.
Your first move should be to tailor the chart's appearance for instant clarity. This isn't just about aesthetics; it's about reducing your cognitive load when things get hectic. Think about setting your bullish candles to a vibrant green and bearish candles to a deep, unmistakable red. This small change makes momentum shifts jump off the screen, helping you see what's happening at a glance.
Calibrating Your Technical Indicators
Once your visual foundation is clean and clear, it's time to layer in the tools that will drive your analysis. It's easy enough to add indicators, but the real skill lies in calibrating them for the specific conditions of the OTC market.
Take volume, for instance. OTC assets often have lower liquidity, which means a sudden volume spike is a huge tell. It can be a powerful confirmation for a breakout or signal an impending reversal. When you add the volume indicator, don't just leave it there—watch how it behaves relative to price. You're hunting for the anomalies, those unusual surges that scream institutional interest or panic selling.
Moving averages are another cornerstone of any solid setup. I personally find a two-MA strategy to be incredibly effective here:
- A short-term Moving Average, like a 9-period EMA, is great for tracking immediate price momentum.
- A long-term Moving Average, such as a 50-period SMA, helps you keep the bigger picture—the overarching trend—in focus.
When these two cross, you often get a very clean signal for a potential entry or exit, one that's tuned to the rhythm of the specific OTC asset you're watching.
The point isn't to plaster your chart with every indicator under the sun. That just creates noise. Instead, pick a handful of tools that give you real, actionable information about the unique volatility and liquidity of OTC instruments.
Using Templates for Maximum Efficiency
So, you've spent the time dialing in your colors, indicators, and settings to perfection. The last thing you want is to have to do it all over again for every new chart. This is where MT4's templates become an absolute game-changer.
Once your chart is set up exactly the way you want it, just right-click on the chart, go to Template, and click Save Template. Give it a memorable name—something like "OTC Weekend Scalper" or "My Core Setup." From now on, you can apply that entire configuration to any new chart with just two clicks.
This is about more than just saving a few minutes. It's about enforcing discipline and consistency in your analysis. When you use the same template for every trade, you ensure you're looking at each opportunity through the exact same lens. This kind of systematic approach is critical for long-term success when trading OTC markets, especially considering that international securities trading volume has already surpassed $415 billion in 2024. A consistent framework is how you position yourself to capture a piece of that action.
Actionable Strategies for Trading OTC Markets

Alright, your charts are clean and ready to go. Now for the fun part: building a strategic edge. Trading the OTC markets isn't like trading blue-chip stocks. You can't just copy and paste a standard strategy and expect it to work here. The unique character of these markets—namely lower liquidity and higher volatility—demands a different approach.
The real trick is to adapt classic trading principles to the specific rhythm of OTC assets. It’s all about creating a toolkit of tactics that thrive in this environment, whether you're capturing quick weekend moves or spotting a reliable breakout before the crowd.
Riding Momentum on the Weekends
One of the best things about using OTC Charts for MT4 is the weekend action. These sessions often have very distinct momentum patterns that you can build an entire strategy around. With fewer institutional players in the game, price movements can be cleaner and more trend-driven.
Here’s a simple but effective way to approach it: combine a fast-moving average (like a 9-period EMA) with a momentum oscillator like the Relative Strength Index (RSI). You wait for a decisive candle to close above the EMA while the RSI also pushes above the 50-line. That double confirmation is a solid signal of upward momentum and a potential entry for a long position. For short trades, you just flip the logic.
Pinpointing Support and Resistance
Support and resistance are trading 101, but they carry a special weight in less liquid markets. In the OTC world, these levels are often major psychological barriers where a wave of buying or selling has previously run out of steam.
First, you need to identify these zones on your chart. Look for areas where the price has reversed multiple times. If an asset has tried and failed to break above $0.50 on three separate occasions, you’ve found a pretty clear resistance level.
So, how do you trade it? You have two main options:
- The Reversal: You can enter a short position as the price nears that known resistance and starts to show weakness, like small-bodied candles or a bearish engulfing pattern. Your stop-loss goes just on the other side of that level.
- The Breakout: The more exciting play is to wait for a strong, high-volume candle to close above the resistance. This often signals a genuine breakout, giving you an opportunity to go long. That old resistance frequently becomes your new support.
The real skill in trading OTC markets isn't just drawing lines on a chart; it's understanding the story the volume tells. A breakout on low volume is often a fakeout, designed to trap eager traders. A breakout accompanied by a massive volume spike, however, suggests real conviction.
This isn't just about penny stocks, either. The global over-the-counter drugs market, valued at over $52.5 billion, is projected to reach nearly $78.8 billion by 2033. This kind of underlying industry growth can fuel sustained trends in related OTC stocks, a dynamic you can track with careful volume and price analysis. You can learn more about these trends in the OTC pharmaceuticals market.
The Art of Volume Analysis
When you're trading OTC markets, volume is arguably the most critical confirming indicator you have. It gives you a peek into the conviction behind a price move, helping you separate the weak signals from the strong ones. A sudden price jump is interesting, sure. But a price jump on 20 times its average daily volume? That’s a five-alarm fire telling you something big is happening.
Let's imagine a stock has been trading flat for weeks. Out of nowhere, your volume indicator spikes massively as the price breaks out of that tight range. That’s your confirmation. The surge in volume validates the breakout, suggesting that a major news event or a wave of new interest is driving the move. This makes it a much higher-probability trade.
Mastering Risk in High-Volatility Environments
Let's be blunt: in the world of OTC markets, the potential for huge gains is always chained to significant risk. The very same volatility that can create life-changing opportunities can just as easily wipe out an unprepared trader's account. Learning to manage that risk isn't just a good idea—it's the one thing that separates traders who make a career out of this from those who quickly burn out.
Your first line of defense is always going to be disciplined position sizing. This simply means you never, ever risk more than a tiny fraction of your account on a single trade. A solid rule of thumb is to keep your risk to 1-2% of your total capital. So, if you're working with a $1,000 account, a 2% risk limit means your maximum loss on any one trade is capped at just $20. This is how you stay in the game, even if you hit a string of bad luck.
Setting Effective Stop-Losses
Think of your stop-loss as your non-negotiable exit plan. It’s the circuit breaker you set before things get emotional. In the fast-paced OTC environment, slippage—where your exit price is worse than you intended—is a constant threat. This makes setting a smart stop-loss a bit of an art form.
Whatever you do, don't just jam your stop right at a support or resistance level. That's where everyone else puts theirs, and it's an easy target for minor market noise. Instead, give the trade some breathing room. A much better practice is to place it slightly beyond a key technical level. For a long trade, that might mean setting it just below the most recent swing low. This simple adjustment can help you avoid getting shaken out of a perfectly good trade by random fluctuations.
The real job of a stop-loss isn't just to prevent a loss. It's to protect your trading capital so you can live to fight another day on a better opportunity. It's a strategic retreat, not a failure.
The Psychology of Sticking to Your Plan
Maybe the single biggest risk in OTC trading isn't a bad stock pick; it's you. Emotional decision-making, especially the fear of missing out (FOMO) when a penny stock starts to rocket, can be completely overwhelming. This is where a written trading plan becomes your anchor in the storm.
Your plan needs to spell out your exact entry criteria, your exit strategy, and your risk rules before you even think about clicking the buy button. The discipline to follow that plan, even when your gut is screaming at you to chase a hot tip, is what separates the pros from the amateurs.
This kind of structured approach is vital, especially when you see sustained growth in certain sectors. For example, the OTC pharmaceutical market is forecasted to grow annually by about 4.84% through 2029, partly because more consumers are choosing self-medication. You can read more about what's driving OTC pharmaceutical growth worldwide.
Seeing a trend like that can be tempting, but only a trader with an unemotional, rock-solid plan can take advantage of it without getting burned. If building that kind of framework feels like a lot to handle on your own, working with a financial advisory service can provide the expert structure and discipline you need to succeed long-term.
Common Questions About OTC Trading
Diving into over-the-counter markets is exciting, but it almost always kicks up a few questions, especially when you're adding new tools like the OTC Charts indicator to your MT4 setup. Let's walk through some of the things traders ask most often so you can get started with confidence.
A huge appeal for many is the idea of weekend trading. Can you really trade when the major exchanges are closed? Absolutely. This is one of the core reasons our indicator is so valuable. While the NYSE or London Stock Exchange might be dark, some brokers keep OTC instruments—think certain currency pairs—running 24/7. Our tool taps directly into that live feed and streams it straight to your MT4 platform.
Are OTC Brokers and Trading Safe?
This is the big one, and for good reason. The safety of your OTC trading experience hinges almost entirely on the broker you choose. It's a fact that these markets have different risk profiles than standard exchanges due to factors like thinner liquidity and less regulatory oversight.
That’s why doing your homework on a broker isn't just a good idea; it's essential. Before you deposit a single dollar, you need to be sure they are reputable and regulated. Your risk management plan—your first line of defense—truly begins with selecting a trustworthy trading partner.
In OTC trading, risk is something you manage, not something you can completely sidestep. True security comes from a mix of three things: a reliable broker, a rock-solid trading plan, and the self-discipline to follow that plan.
Troubleshooting the OTC Charts Indicator
So, you've loaded the indicator, but your chart is blank. It’s a common hiccup and usually a quick fix. Don't panic.
Here’s the typical checklist I run through with traders:
-
Check Your Main MT4 Settings: First, head over to Tools > Options > Expert Advisors. You absolutely must have the “Allow DLL imports” box checked. The indicator simply can’t pull in data without this permission.
-
Check the Indicator's Properties: When you drag the indicator onto a specific chart, a settings box pops up. Go to the "Common" tab within that box and make sure "Allow DLL imports" is checked there as well. It’s a separate permission for each instance of the indicator.
-
Verify Your Server Connection: Glance at the bottom-right corner of your MT4 terminal. Do you see green bars and a "Connected" status with changing kbps? If it says "No Connection" or "Invalid Account," the problem is with your broker's server, not the indicator.
Running through these steps solves the issue 99% of the time. For more insights and updates on market events that might impact your strategies, be sure to check the latest OTC trading news on our site.
Ready to elevate your trading with professional-grade tools? OTC Charts MT4 provides the real-time, precise data you need to gain a competitive edge. Get started today and transform your MT4 platform into a powerful hub for OTC market analysis. https://otc-charts-mt4.com