
Think of backtesting as a dress rehearsal for your trading strategy. It’s the process of taking your specific trading rules and running them against historical market data to see how they would have actually performed in the past. You're defining your strategy, grabbing old data, and simulating trades to measure everything from profit and loss to risk. It’s the single best way to validate an idea before you put real money on the line.
Why Backtesting Is Your Secret Weapon in Trading
Before you even think about risking a single dollar in the live markets, you have to ask yourself a tough question: does my trading idea actually have a statistical edge? Relying on gut feelings or a hot tip is a surefire way to empty your account. This is precisely why backtesting is so crucial—it transforms your trading from a guessing game into a data-driven discipline.
Consider it your personal trading lab. It's a risk-free environment where you can test, tweak, and ultimately prove (or disprove) your strategies without any real-world consequences. The concept is straightforward but incredibly powerful: you're essentially a time traveler, applying your exact entry, exit, and risk management rules to past market scenarios to see what would have happened. The result is a clear, objective report card on your strategy's performance.
Uncover Flaws and Get a Handle on Risk
Let’s be honest: every trading strategy has a weakness. The goal of backtesting is to find it before the market does—and exploits it with your capital. By simulating your rules across different historical periods, you get a clear picture of how your strategy holds up in various environments.
- Bull Markets: Does your strategy effectively ride the wave, or does it get out too early, leaving big profits behind?
- Bear Markets: How well does it protect your capital when prices are plummeting? What’s the most painful drawdown you should be prepared to endure?
- Sideways Markets: Does the strategy get whipsawed by choppy, directionless price action, racking up a string of small, frustrating losses?
Answering these questions is risk management in its purest form. It helps you set realistic expectations for both potential gains and the inevitable drawdowns. Knowing this ahead of time is what gives you the confidence to stick to your plan when you're trading with real money. Platforms like MetaTrader 4 have built-in tools, such as the Strategy Tester, designed specifically for this kind of analysis.
Here’s a look at the MetaTrader 4 interface, a common platform where traders build strategies and run these automated tests.
This is the kind of environment where you can visually build out your ideas with charts and indicators before letting the backtester run the numbers.
Moving From Guesswork to Data-Backed Decisions
At its core, backtesting is about simulating your trading rules on historical data to see if a strategy has any merit. A robust test needs a good chunk of data—often 10 years or more—to generate meaningful statistics like net profit, maximum drawdown, and win rate. This objective, data-first approach is your best defense against emotional decision-making, giving you hard evidence to either support or discard a trading idea. You can learn more about crafting a complete backtesting plan by checking out the playbook on chartswatcher.com.
Backtesting isn't about finding a crystal ball to predict the future. Its real power is in stress-testing your logic against the messy reality of the past. A strategy that can survive years of historical data has a much better fighting chance in the live markets.
Building Your Backtesting Toolkit
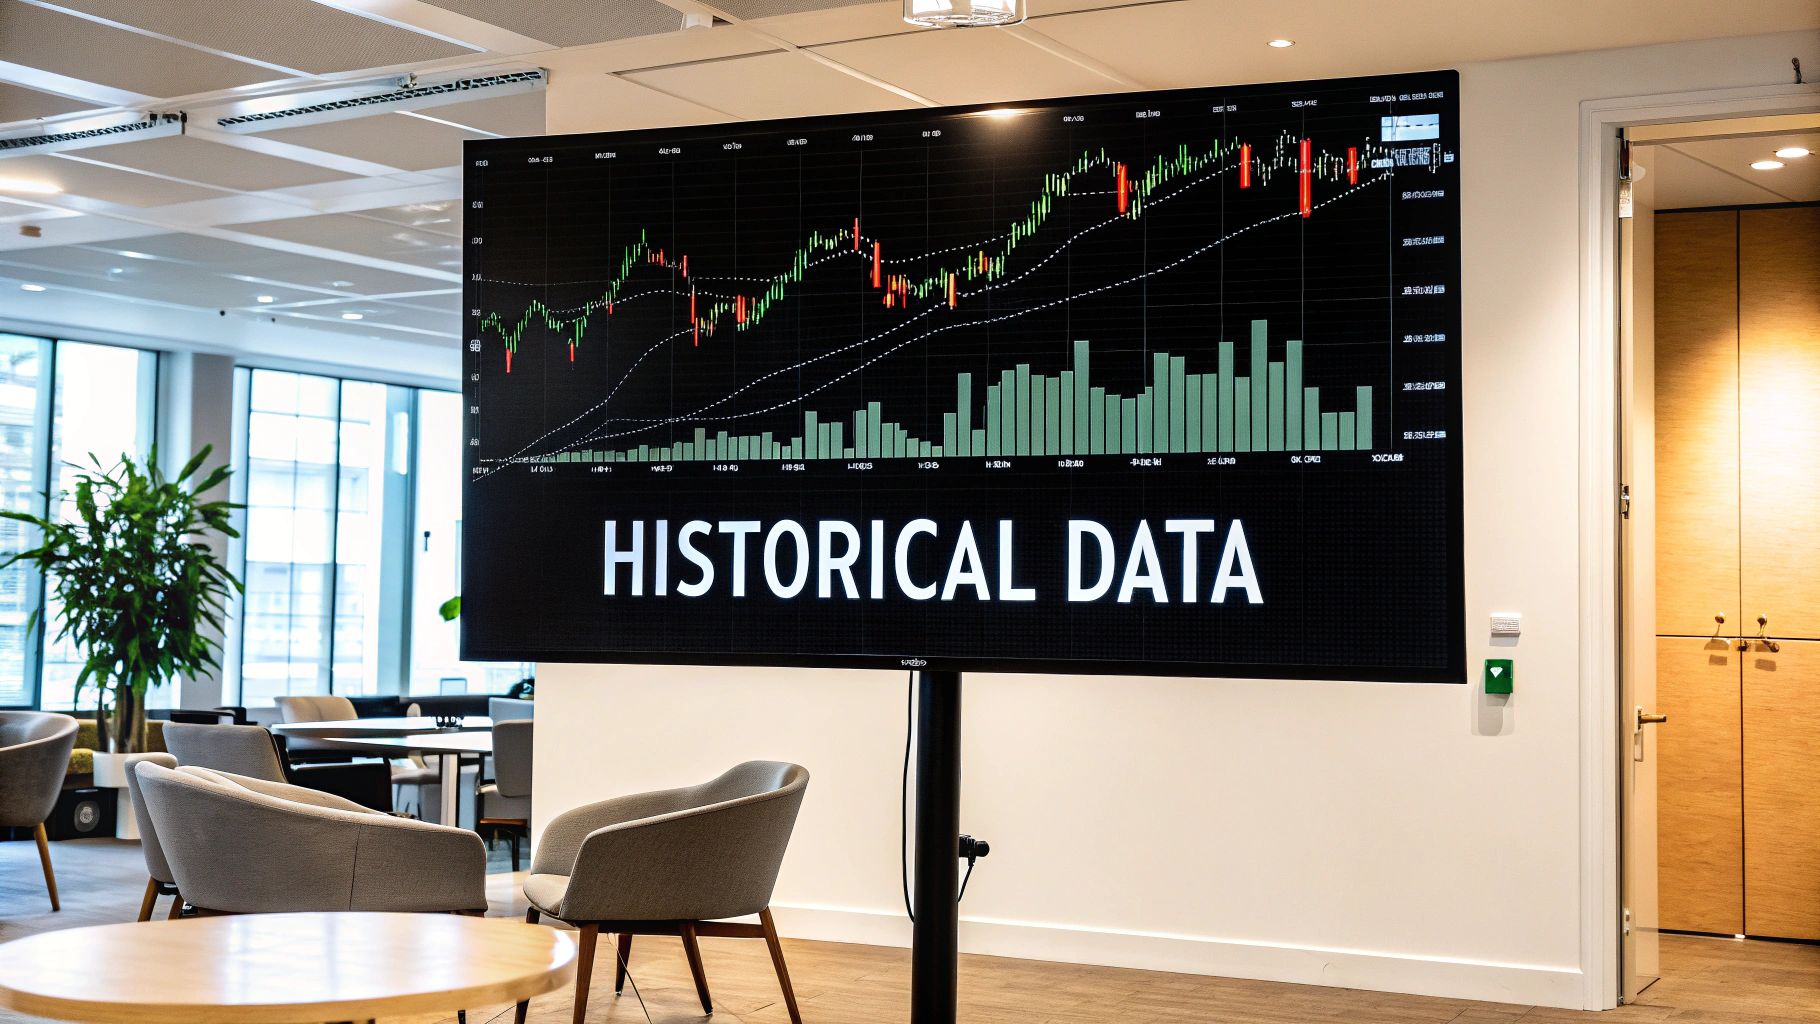
A reliable backtest is only as good as its foundation. In my experience, that foundation rests on two pillars: the quality of your historical data and the capability of your backtesting software. Getting these two things right is absolutely non-negotiable if you want results you can actually trust.
Think of it like building a house. If you start with flawed blueprints or use shoddy materials, you're just setting yourself up for disaster. The same principle applies here. Your first job is to get your hands on clean, accurate historical data. The quality of this data directly dictates the reliability of your test results. It's a classic case of garbage in, garbage out.
Free data, which you can often get from brokers or basic charting platforms, can be a decent starting point. It's accessible and lets you get a feel for the backtesting process without spending a dime. But be warned, it usually comes with significant limitations, like data gaps or a short historical range, which can seriously skew your results. For any serious analysis, paid data is almost always the way to go, offering cleaner, more comprehensive tick-level information.
Choosing Your Backtesting Software
Once your data is sorted, the next big decision is your software. The market is flooded with options, and they all cater to different needs, skill levels, and budgets. The trick is to find a tool that truly aligns with what you're trying to accomplish.
You can really break down backtesting software into three main camps:
- Integrated Platform Testers: Think of the Strategy Tester built right into MetaTrader 4. These are incredibly convenient, especially for strategies that rely on standard indicators already on the platform. Their user-friendly interfaces make them a great entry point for anyone new to automated testing.
- Standalone Backtesting Software: Dedicated programs like TradeZella or the advanced features in TradingView offer far more flexibility and often support a wider range of asset classes. They come packed with robust analytics and reporting tools that dig much deeper into performance metrics than most integrated testers can.
- Custom Scripts (Python/R): This is the path for ultimate control. Many advanced traders I know eventually build their own backtesting engines using languages like Python. It demands technical skill, no doubt, but it lets you test highly complex or unconventional strategies that off-the-shelf software simply can't handle.
Key Takeaway: Your software choice should be a direct match for your strategy's complexity and your own technical comfort zone. There's no point paying for advanced features you'll never touch, but you also don't want to hamstring a great strategy with a tool that’s too basic.
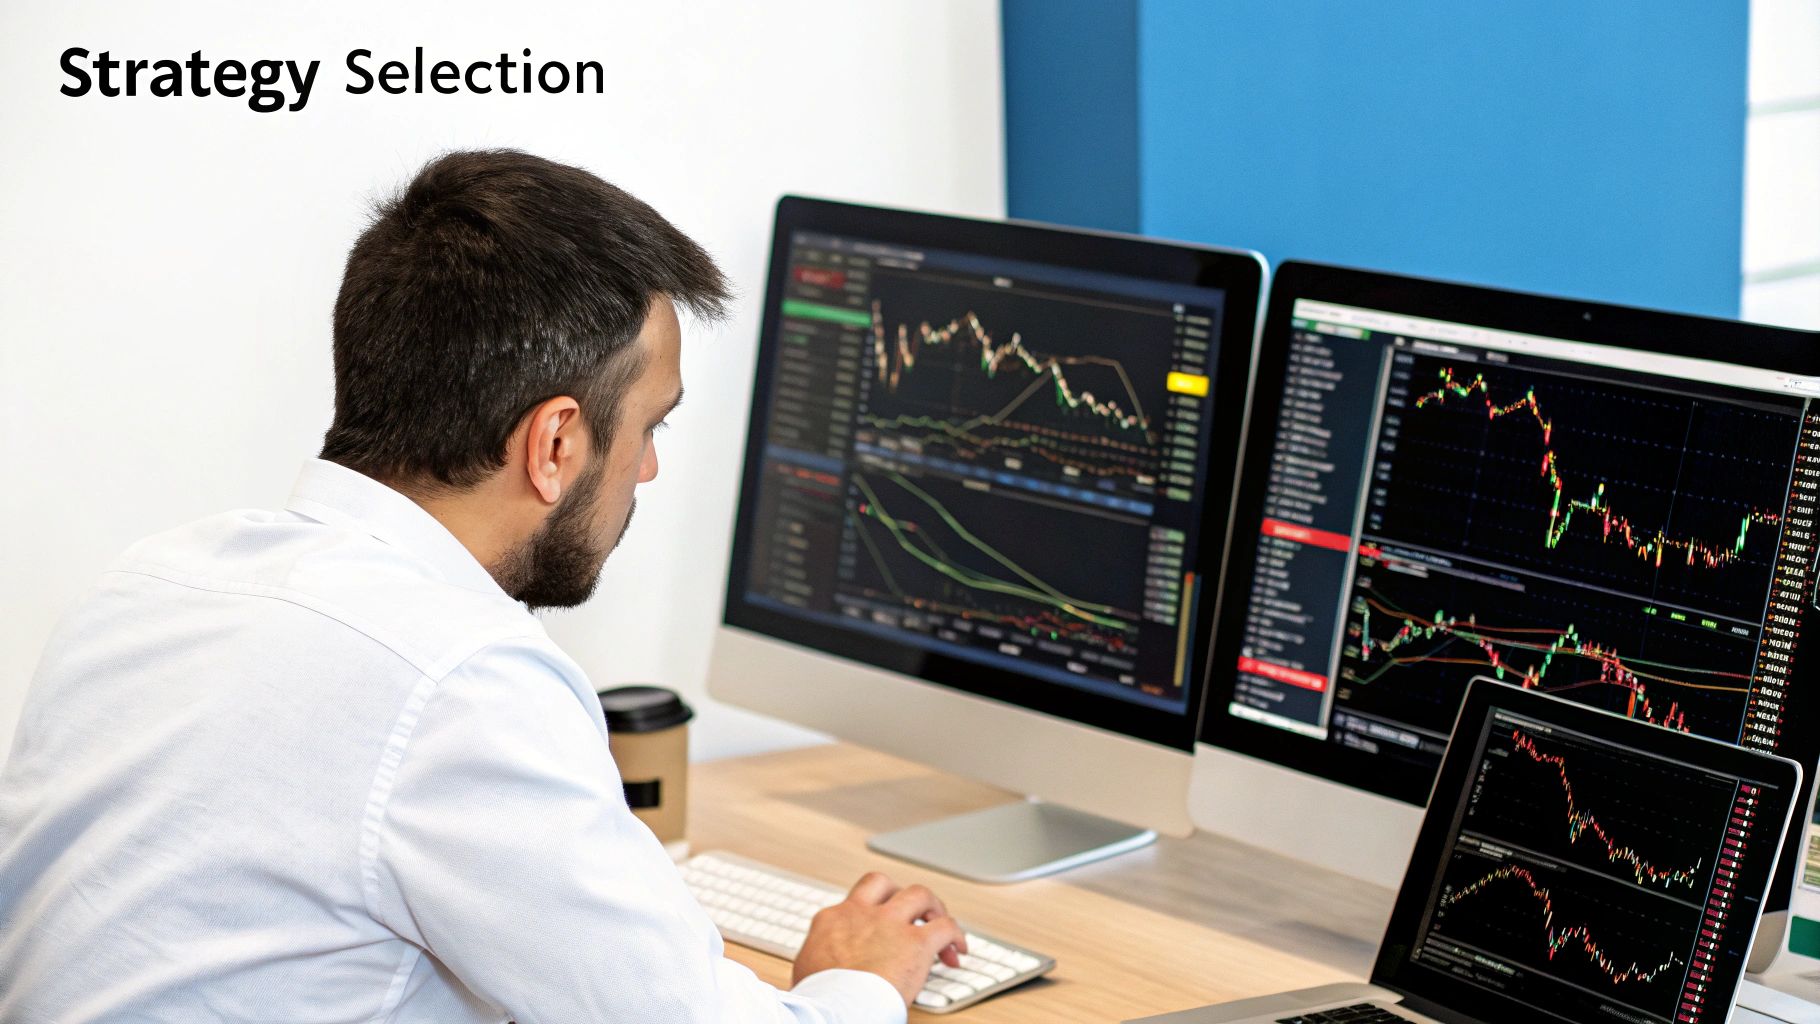
Selecting the Right Tool for You
So, how do you actually decide? Start by taking a hard look at your needs. Is your strategy a simple one, maybe based on a couple of moving averages? An integrated tester in your trading platform will probably do the job just fine.
But if you’re testing a more nuanced strategy across, say, both forex and stocks, a dedicated standalone tool is likely a much better fit.
Also, think about your long-term process. Keeping a detailed log of every test is what separates the pros from the amateurs. It’s how you systematically refine your edge over time. Taking a look at some well-structured trading journal examples can give you a fantastic template for what to track during your backtesting.
Ultimately, the best toolkit is the one that empowers you to test efficiently and analyze the results with total clarity.
Running Your First High-Quality Backtest
This is the moment of truth. It's where your brilliant trading idea gets a reality check against historical data. Running a backtest that you can actually trust isn't about just clicking a "start" button—it's a methodical process of defining every single rule your strategy has to live by.
The main goal here is to eliminate any and all ambiguity. A computer doesn't know what you mean to do; it only knows what you tell it to do. That means your strategy needs to be perfectly clear before you even think about running a simulation.
Defining Your Strategy Rules with Precision
The first practical step is to translate your trading idea into a concrete set of non-negotiable rules. If you can't write it down as a clear "if this, then that" statement, you can't backtest it properly. Think of this as the DNA of your trading approach.
A classic moving average (MA) crossover strategy is a perfect example to start with. The rules might look something like this:
- Entry Signal: Buy when the 50-period MA crosses above the 200-period MA on the daily chart.
- Exit Signal (Profit): Sell when the 50-period MA crosses back below the 200-period MA.
- Stop-Loss: Get out of the trade if the price drops 5% below your entry price. This is non-negotiable risk management.
- Position Sizing: Never risk more than 1% of your total account equity on any single trade.
Every one of these parameters has to be spelled out and programmed into your backtesting software. This is the only way to get a reliable simulation. To keep everything straight, it's a fantastic habit to use a structured document. You can see how the pros do it with a dedicated trading plan template.
Thanks to modern computing power, this process is more accessible than ever. Automated software lets us apply these rigid rules to years of data, giving us a peek into how a strategy might have performed without risking a single dollar. Research from places like QuantInsti consistently shows that traders who rigorously backtest their ideas have a much better shot at long-term success. It just makes sense—you're refining your rules and optimizing your approach before you step into the live market.
Configuring Critical Backtest Settings
With your rules locked in, the next step is to configure the technical environment for the test itself. These settings are just as crucial as your strategy because they dictate how realistic the simulation will be. I’ve seen countless traders get burned by ignoring these details, leading to wildly optimistic and completely misleading results.
Pay close attention to these three core settings:
-
Date Range: Your test period needs to be long enough to cover different market moods. If you only test your strategy in a raging bull market, of course the results will look amazing—and be totally useless. I always recommend a period of at least 5-10 years to see how your system holds up in bull, bear, and sideways markets.
-
Transaction Costs: Every trade has a cost. You absolutely must account for spreads, commissions, and slippage. Forgetting to include these will make your profits look much better than they would be in the real world. A good rule of thumb is to add a conservative estimate for slippage on top of your broker's standard commissions and average spread.
-
Data Modeling Quality: In platforms like MetaTrader 4, you get to choose the quality of your data model. "Every tick" mode is the gold standard for accuracy because it simulates price action within each candle, but it's also the slowest. Faster options like "Control points" or "Open prices only" can easily miss important intra-bar price spikes that would have triggered your stop-loss.
Pro Tip: Always run your final, most serious backtest using the highest-quality data model available, like "Every tick." Yes, it takes more time, but the accuracy is vital if you're planning to trade the strategy with real money. A fast but inaccurate test is worse than no test at all.
Decoding Your Backtest Performance Report
Once you've run a backtest, the real work begins. Generating the report is easy; the true skill is in knowing what all those numbers are telling you about your strategy's future. It’s incredibly tempting to just glance at the net profit and call it a day, but that single number reveals almost nothing about the journey—the risk, the volatility, and the psychological grit you'll need to actually trade it live.
To really know if a strategy is worth your time and capital, you have to dissect its performance report like a pro. This means digging past the flashy headline figures and getting into the metrics that expose the true character and durability of your trading system. This is what truly knowing how to backtest trading strategies is all about.
Key Metrics That Tell the Real Story
When that report lands in front of you, a few key numbers should immediately grab your attention. These metrics paint a vivid picture of the strategy's risk-to-reward profile and act as the vital signs for your trading system's health.
Here’s what I always look for first:
- Profit Factor: This is your gross profit divided by your gross loss. A number above 1.0 technically means you're profitable, but from my experience, you should be looking for at least 1.75 to have a comfortable buffer.
- Maximum Drawdown: This is the biggest drop your account equity took from a peak to a subsequent low. It's a raw, honest measure of the most painful losing streak you would have had to sit through. This is absolutely critical for risk management.
- Sharpe Ratio: This metric measures your risk-adjusted return. A higher Sharpe Ratio (I aim for anything over 1.0) suggests you're getting a better return for the amount of risk you’re taking on.
- Win/Loss Ratio & Average Trade: This shows how often you win versus how much you win (or lose) on average. A low win rate isn't a dealbreaker if your average winning trade is multiples larger than your average losing one.
The image below gives you a sense of how different backtesting platforms stack up. The choice of platform itself can influence how you set up and analyze these very metrics.
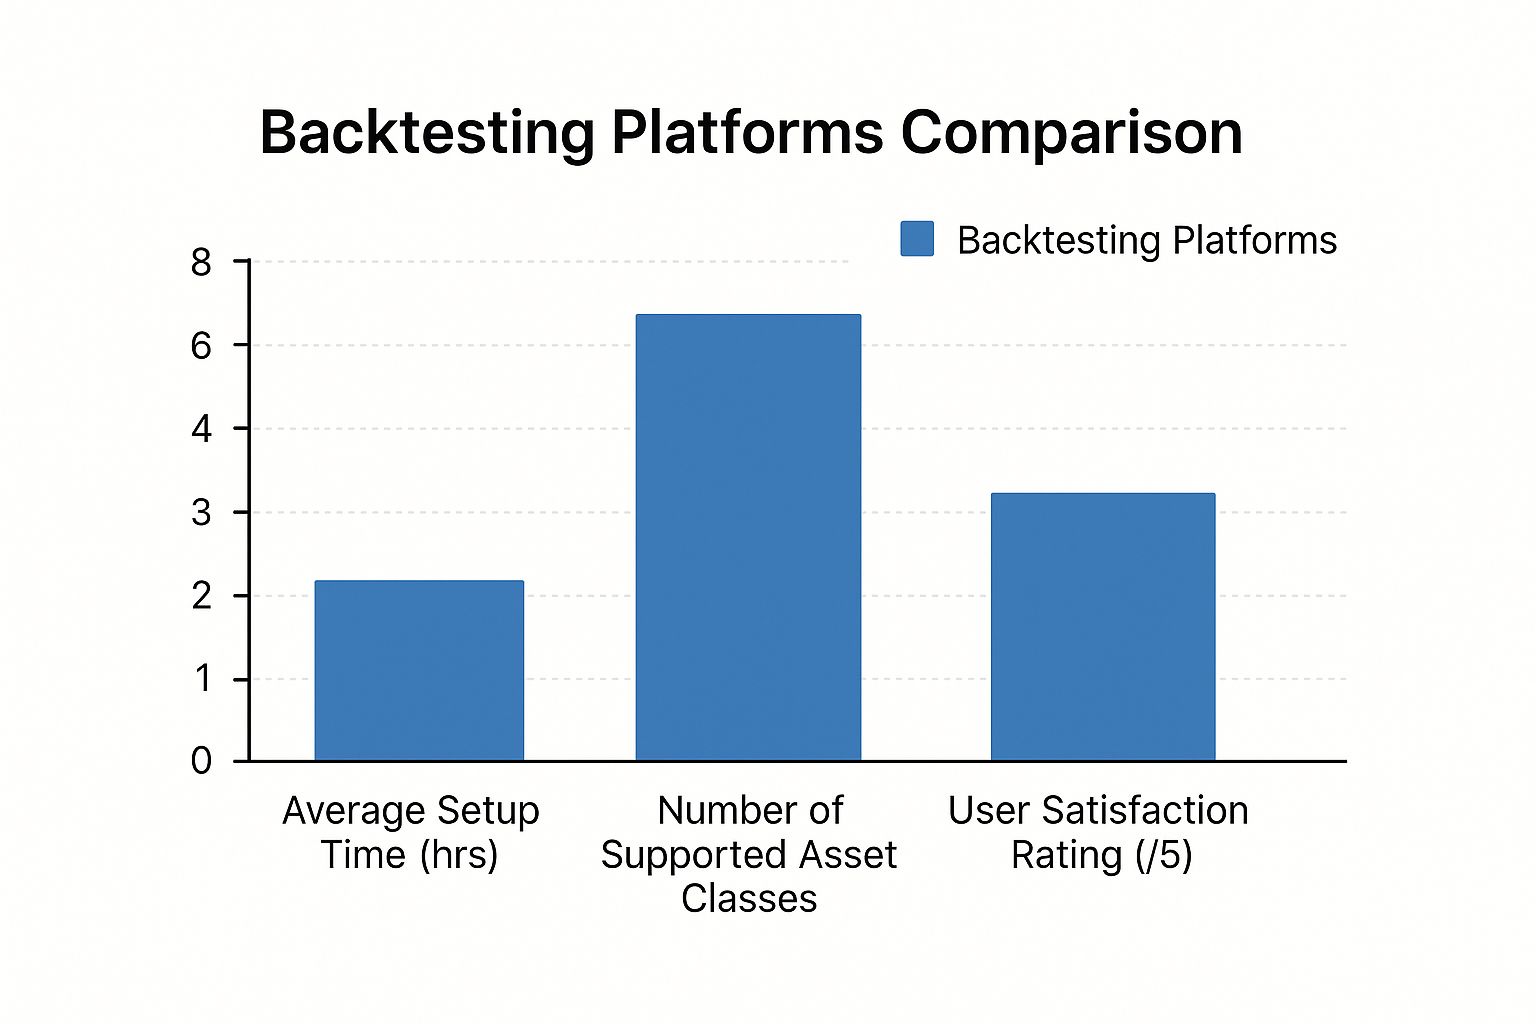
As you can see, there's often a trade-off between how easy a platform is to use and the range of assets it supports—something to keep in mind when picking your tool.
Putting It All Together: What Does a "Good" Backtest Look Like?
So, what makes a backtest "good"? There's no magic formula, as a lot depends on your personal risk tolerance and trading style. For one trader, a 30% drawdown might be acceptable for a high-return strategy, while another would never sleep at night with that kind of risk.
A truly robust strategy, however, will show a healthy balance across multiple metrics. A high profit is great, but not if it comes with terrifying drawdowns that would cause you to abandon the system at the worst possible moment.
To help you make sense of it all, here’s a quick guide to the most important performance metrics and what they really mean.
Key Backtesting Performance Metrics Explained
| Metric | What It Measures | Why It's Important |
|---|---|---|
| Profit Factor | The ratio of gross profit to gross loss. | A figure above 1.75 suggests a solid edge that can absorb transaction costs and some market noise. |
| Max Drawdown | The largest percentage drop from a portfolio's peak value. | This is your reality check. It tells you the worst-case losing streak you would have faced and if you can stomach it. |
| Sharpe Ratio | The average return earned in excess of the risk-free rate per unit of volatility. | A ratio above 1.0 indicates your returns are strong relative to the volatility you had to endure to get them. |
| Total Trades | The total number of trades executed during the backtest period. | A sample size of over 100 trades is needed for the results to be considered statistically significant. |
| Average Win/Loss | The average monetary gain of winning trades versus the average loss of losing trades. | It helps you understand the strategy’s dynamic. Is it winning small and often, or winning big but less frequently? |
These metrics, when viewed together, give you a complete and honest assessment of your strategy’s potential.
A strategy boasting a 90% win rate but a tiny profit factor is often far riskier than one with a 40% win rate and large average winners. Headline numbers can be incredibly deceptive; you have to dig into the risk metrics.
Ultimately, reading a backtest report comes down to answering one simple question: "Can I psychologically and financially handle trading this system in the real world?" The answer isn't in the final profit number. It's hidden in the drawdowns, the risk-adjusted returns, and the overall consistency of the performance.
Common Backtesting Traps You Need to Avoid
It’s a rite of passage for almost every trader. You build a strategy, backtest it, and the equity curve shoots for the moon. It looks perfect. But when you switch to live trading, that beautiful curve collapses, taking real money with it.
This painful scenario usually boils down to a few common, but devastating, backtesting traps. Understanding these pitfalls isn't just about good practice; it's about protecting your capital. The most famous culprit is overfitting, or as it's sometimes called, curve-fitting.
This is what happens when you tweak and optimize your strategy until it perfectly mirrors the historical data you're testing it on. You’ve essentially forced the strategy to "memorize" the past, making it incredibly brittle and unable to handle the new, unseen data of a live market. It’s a classic case of winning the battle but losing the war.
Spotting Overfitting and Lookahead Bias
So, how do you know if you’ve overfit your strategy? A tell-tale sign is a system that works brilliantly on your initial test period but completely falls apart on a different chunk of data. This is why you must always validate your results on out-of-sample data—a separate piece of history your strategy has never seen before. If the performance nosedives, you’ve likely got an overfit model.
Another sneaky error that invalidates results is lookahead bias. This happens when your test accidentally uses information that wouldn't have been available at the moment of the trade. Think about it: using the closing price of a candle to decide on an entry at the open of that same candle is a form of trading with future knowledge. It's a subtle mistake, but it completely poisons the well.
A backtest is your lab experiment. Any contamination, whether it’s from curve-fitting the data or accidentally peeking into the future, makes your results worthless. The goal is to simulate reality, with all its imperfections, not to create a fantasy performance report.
Are Your Results Statistically Meaningful?
Confidence in your backtest comes from solid data. If your test only produces 20 or 30 trades, the results could easily be a fluke. A lucky streak isn't a strategy. You should always aim for a sample size that's statistically relevant—a bare minimum of 100 trades is a good starting point, though more is always better.
Your test should also span a significant amount of time, ideally covering different market conditions like bull, bear, and sideways markets. This is crucial when dealing with less conventional assets. For instance, our guide on trading OTC markets dives into the unique characteristics you need to account for in those environments.
Finally, don't forget to build in the frictions of real-world trading. Your backtest must account for:
- Commissions: Every broker charges something. These small fees add up.
- Spreads: The gap between the bid and ask price is a direct cost on every single trade.
- Slippage: The market moves. The price you think you'll get and the price you actually get are rarely identical.
Ignoring these costs is one of the easiest ways to inflate your performance metrics. By actively hunting for these traps—overfitting, lookahead bias, and unrealistic assumptions—you give your strategy a real shot at succeeding where it actually counts: in the live market.
A Few Common Questions About Backtesting
When you're getting started with backtesting, you're bound to run into a few questions. That's completely normal. Getting these fundamentals right from the beginning will give you the confidence that you're building your trading approach on solid ground.
Let's tackle some of the most common ones I hear from traders.
How Much Historical Data Do I Really Need?
This is probably the most frequent question, and the honest answer is: it depends. There isn't a single magic number that fits every situation.
A much better way to think about it is aiming for a statistically relevant number of trades. A solid benchmark is to use enough data to generate at least 100-200 trades. If your strategy trades multiple times a day, a single year of data might be plenty. But if you're working with a long-term system on daily charts, you could easily need 10 years or more to see how it weathers different market cycles like recessions and bull runs.
Does a Great Backtest Guarantee Future Profits?
I wish I could say yes, but the answer is a firm no. It's crucial to understand what a backtest is—and what it isn't. It’s a simulation of the past, not a prediction of the future.
A strong backtest is your first proof of concept. It tells you that your logic had a statistical edge historically. What it can't do is account for sudden market shocks, changes in liquidity, or fundamental shifts in how a market behaves.
That's why a positive backtest is just the starting line, not the finish.
Backtesting vs. Forward Testing: What's the Difference?
Many traders get these two confused, but they are both essential parts of a robust testing process. The distinction is pretty straightforward.
- Backtesting is a look backward. You run your strategy rules against historical price data to see how it would have performed. It’s fast and efficient.
- Forward Testing (often called paper trading) is a look forward. You apply your strategy to a live market feed in real-time, but without risking actual capital.
Think of it like this: backtesting is where you prove the theory. Forward testing is where you confirm it works in the messy, unpredictable conditions of the current market. Skipping from a good backtest straight to a live account is one of the biggest mistakes you can make. Always bridge that gap with forward testing.
And one final thought: how often should you re-check your work? Markets change. A brilliant strategy from two years ago might lose its edge. I recommend reviewing your strategy’s performance every quarter or so and running a full, fresh backtest at least once a year to make sure it's still sound.
Ready to elevate your trading with professional-grade tools? OTC Charts MT4 provides the real-time, precise data you need to backtest and execute your strategies on Pocket Option with confidence. Gain the edge you've been looking for.