
It's a common misconception, especially for traders just starting out, that a high win rate is the secret sauce to profitability. While it definitely feels good to win often, what truly separates consistently profitable traders from the rest is an obsession with one single metric: the risk-to-reward ratio.
This simple calculation, which weighs your potential loss against your potential gain, is the bedrock of any sustainable trading strategy. It’s what keeps you in the game long enough to succeed.
Why Risk-to-Reward Is Your Most Important Trading Metric
Let's be real. It's easy to get caught up in the thrill of a winning streak. But I’ve seen countless traders with impressive win rates blow up their accounts. Why? Because the few trades they lost were so catastrophic they wiped out all their previous gains, and then some.
Imagine you have a strategy that wins 90% of the time. Sounds foolproof, right? But what if your average winning trade makes you $50, while your average losing trade costs you $500? That single loss erases the profit from ten winning trades. This is precisely why savvy traders focus on risk-to-reward before anything else. It brings discipline and a mathematical edge to your decision-making.
By defining your risk (stop loss) and potential reward (take profit) before you even place a trade, you take emotion out of the equation. You stop gambling and start operating like a business. This shift in mindset is everything.
This isn't just a concept for individual day traders. It’s used at the highest levels of finance. For instance, a long-term analysis of the global multi-asset market portfolio from 1960 to 2017 found an annualized real return (the reward) of 4.45%. The standard deviation, a measure of risk, was 11.2%. This gives the market a historical risk-to-reward ratio of about 0.40, a benchmark that institutional funds use to evaluate performance.
For you as a retail trader, the principle is the same, just applied on a trade-by-trade basis. It's the core of your risk management and sits alongside other critical trading performance metrics that measure your edge. It's less about abstract theory and more about the nitty-gritty of protecting your capital while letting your winners run.
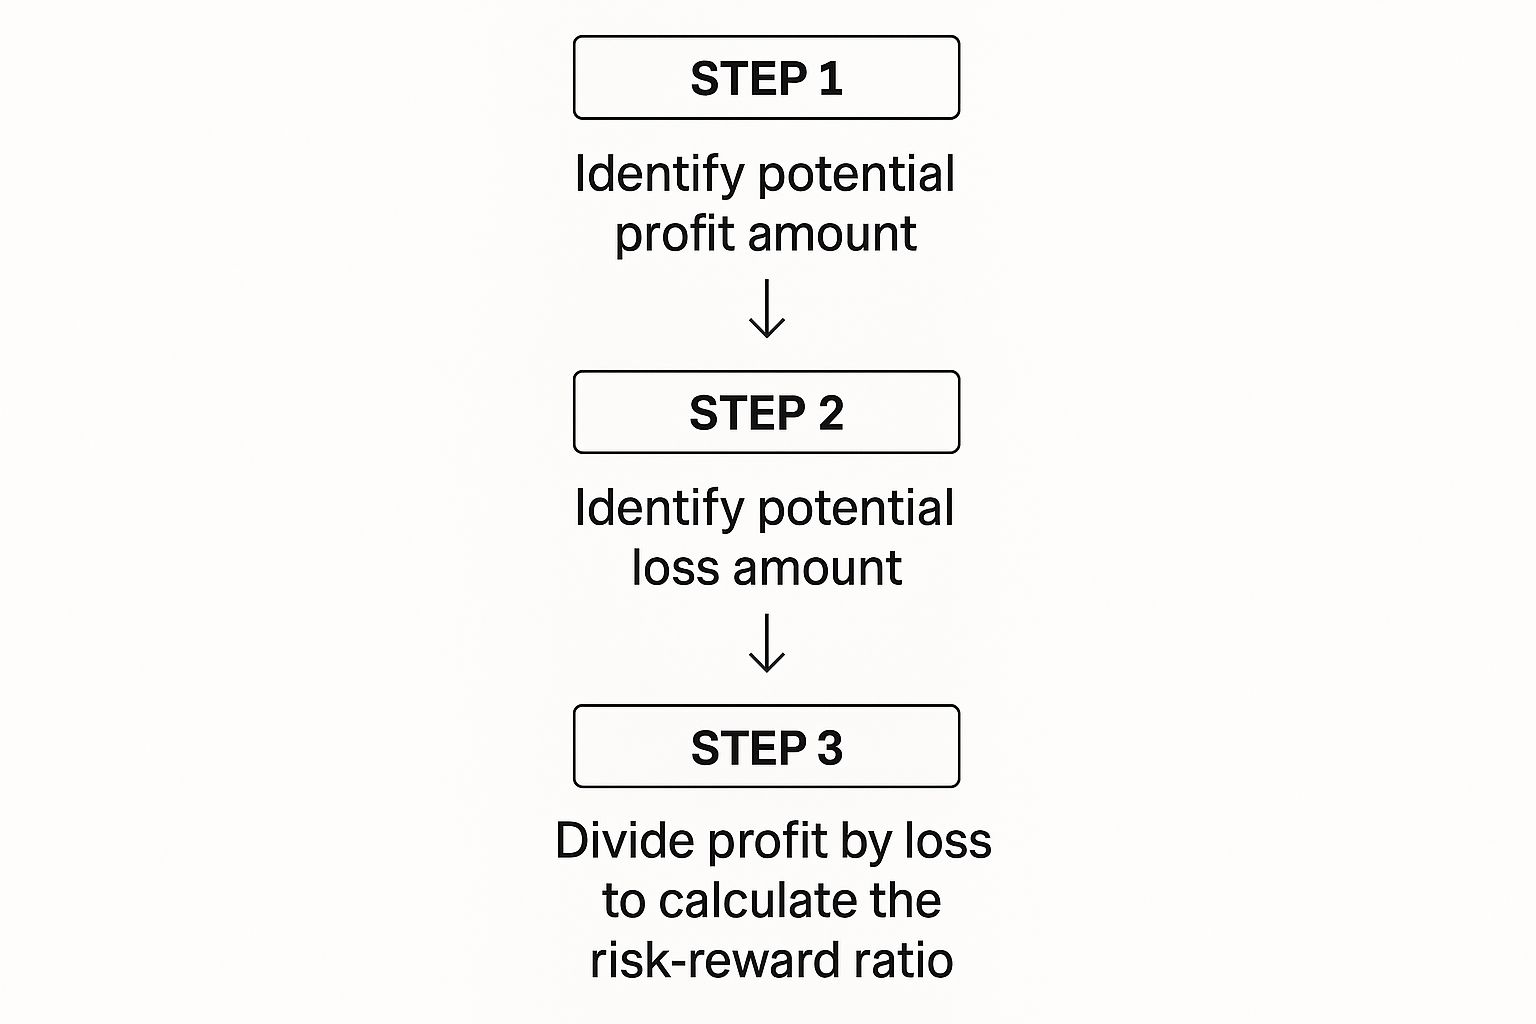
How to Calculate the Risk-Reward Ratio
Alright, let's get practical. Figuring out your risk-reward ratio isn't some complex academic exercise. It's a simple, back-of-the-envelope calculation you should be doing before every single trade. It all boils down to three numbers you absolutely must define before you enter the market: your entry price, your stop-loss, and your take-profit target.
The core idea is to divide what you stand to gain by what you're willing to lose. That's it. This gives you a hard number that tells you if the trade is even worth your time and capital.
For a long (buy) trade, the math looks like this:
- Potential Reward = Take-Profit Price – Entry Price
- Potential Risk = Entry Price – Stop-Loss Price
The Formula Unpacked:
Risk-Reward Ratio = (Take-Profit Price – Entry Price) / (Entry Price – Stop-Loss Price)
Let’s run through a real-world example on a pair I'm sure you've looked at a thousand times: the EUR/USD.
A EUR/USD Trade Example
Let's say you're looking at your OTC Charts MT4 and spot a solid support level forming around 1.0700 on the EUR/USD. Your analysis tells you there's a good chance the price will bounce here, so you're planning to go long.
A professional trader doesn't just jump in. You need a plan. You'd place a stop-loss just below that support to get you out if the level breaks. You'd also look for the next logical resistance area to set your profit target.
Here’s how that might look:
- Entry Price: You get into the trade, buying EUR/USD at 1.0710.
- Stop-Loss Price: You set your safety net at 1.0680, which is a 30-pip risk.
- Take-Profit Price: The next resistance is at 1.0800, so you place your profit target there for a potential 90-pip gain.
Now, let's do the math. Your potential reward is 90 pips (1.0800 – 1.0710). Your potential risk is 30 pips (1.0710 – 1.0680).
So, you take 90 pips / 30 pips, which gives you 3. This translates to a 1:3 risk-reward ratio. In plain English, for every dollar you're risking, you're aiming to make three. That's a trade with a solid, positive expectancy.
The real power here isn't just the simple division. It’s the discipline of defining your exit points before you're in the trade and emotions are running high. This is what separates guessing from professional trading. By grounding your entry, stop, and target in actual technical analysis—not just wishful thinking—you create a repeatable, disciplined framework for managing every position.
Example Risk Reward Ratio Scenarios
Just to drive the point home, look at how small adjustments to your stop-loss or take-profit on the exact same trade idea can completely change the quality of the setup.
| Scenario | Potential Reward (Pips) | Potential Risk (Pips) | Risk-Reward Ratio | Verdict |
|---|---|---|---|---|
| Aggressive Target | 140 | 30 | 1:4.6 | Excellent ratio, but is the target realistic? |
| Balanced (Our Example) | 90 | 30 | 1:3 | Great balance of risk and realistic profit. |
| Conservative Target | 45 | 30 | 1:1.5 | Still positive, but less compelling. |
| Wide Stop | 90 | 60 | 1:1.5 | Worsens the ratio by increasing risk. |
| Unfavorable | 30 | 45 | 1:0.67 | A trade you should absolutely walk away from. |
As you can see, the ratio isn't static. It's a direct reflection of your trade management decisions. A great entry signal can easily be turned into a terrible trade with poor stop or target placement. Your job is to find the sweet spot where the reward justifies the risk you're taking.
From Theory to the Trading Floor: Applying the Ratio in Real-Time
It's one thing to understand the risk-reward formula on paper, but it's another thing entirely to apply it when the market is moving. Let's bridge that gap and see how this plays out on a real trading chart, just like you would on your MetaTrader 4 platform.
This is what a professional trading setup looks like. You have your price action, your indicators, and your execution tools all in one place.
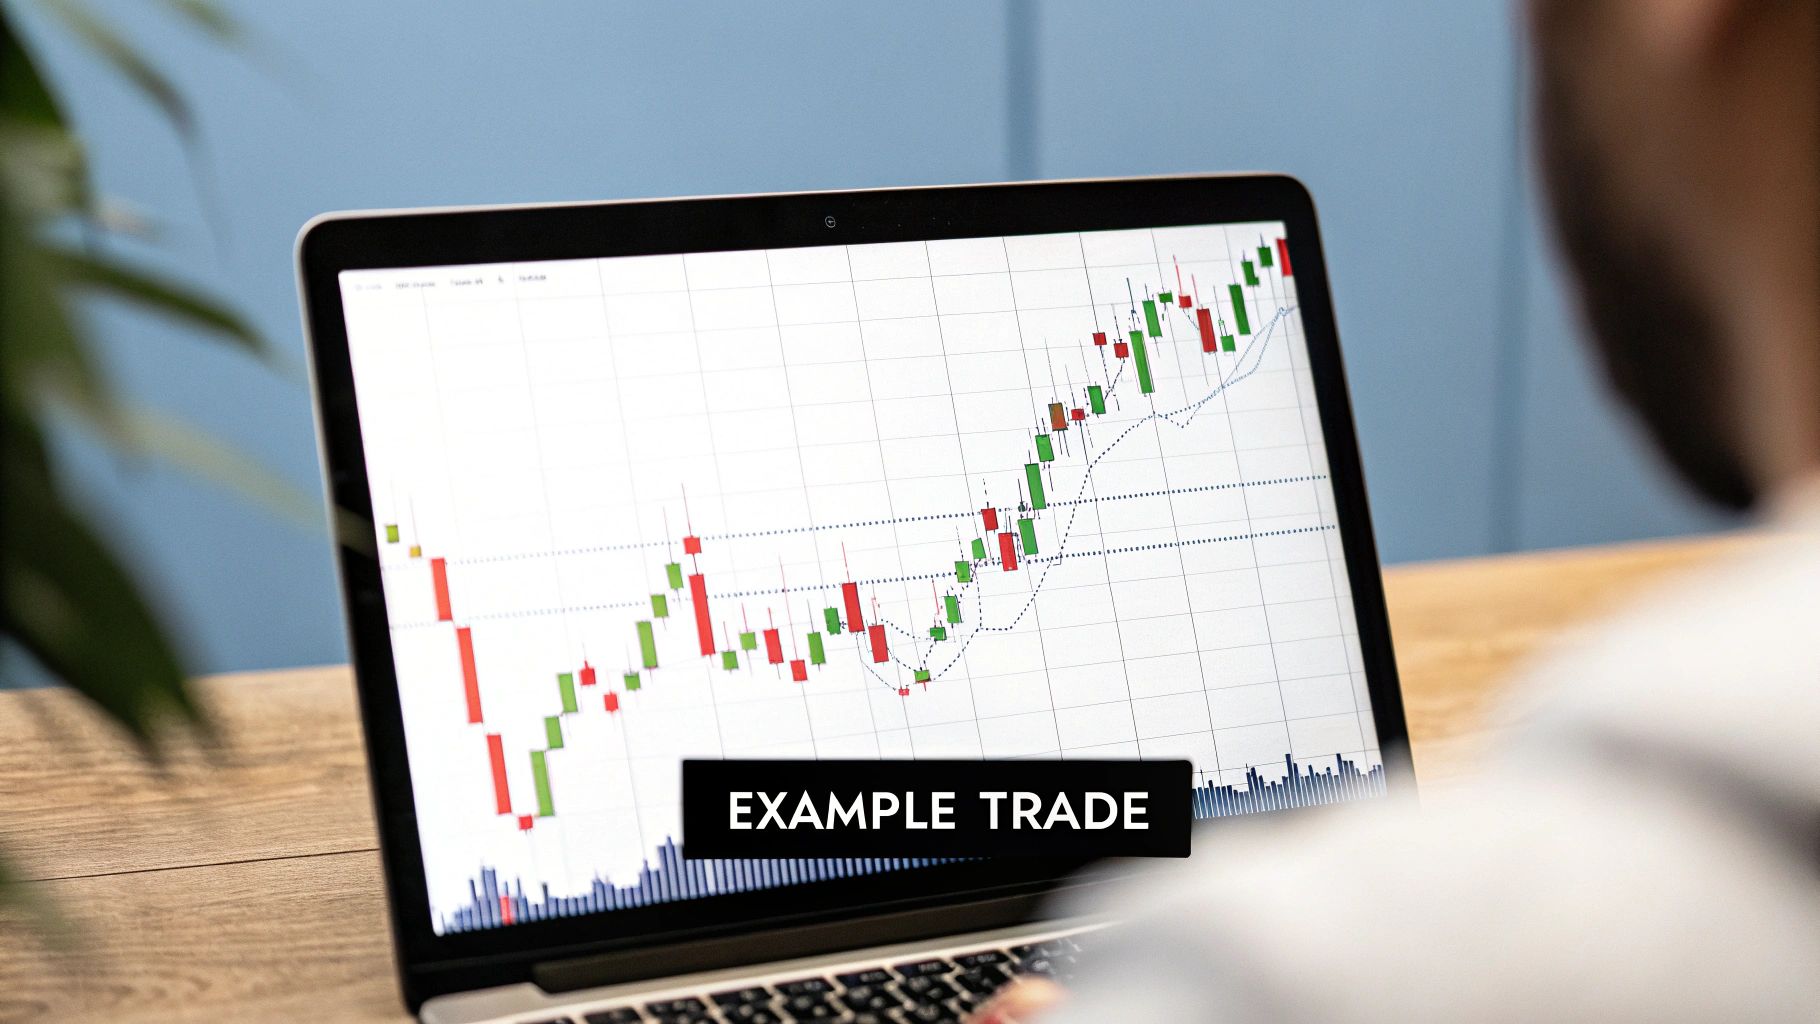
On a live chart, your job is to find logical, defensible points for your entry, stop-loss, and target. These aren't just random numbers; they're based on what the market itself is showing you.
Walking Through a Classic Breakout Trade
Let's imagine you're watching a stock that's been stuck in a sideways grind, bouncing between a clear floor and ceiling for days. This kind of consolidation often coils up for a big move. Your plan is to go long—to buy—if the price finally smashes through the top of that range. This is a classic breakout trade.
Let's put some real numbers on it.
- The top of the consolidation range is $50.00.
- You see a powerful candle close above that level, and you enter the trade at $50.20.
- This is your entry point. Now, let’s do the risk-reward ratio calculation.
Defining Your Risk and Reward
First, where do you place your stop-loss? The most logical spot is just below the structure you're breaking out from. Placing it at $49.70 gives the trade room to breathe but gets you out if the breakout fails.
- Your Risk: The distance from your entry ($50.20) to your stop-loss ($49.70) is $0.50 per share.
Next, where’s your target? You scan the chart to the left and see the next significant area of resistance is sitting at $51.70. That’s a sensible place for the momentum to run out of steam.
- Your Reward: The distance from your entry ($50.20) to your take-profit ($51.70) is $1.50 per share.
Now, the math is straightforward: $1.50 (Potential Reward) / $0.50 (Potential Risk) = 3.
You've just engineered a trade with a 1:3 risk-reward ratio. That’s an excellent setup by any trader's standard.
This is how professional trading works. Your chart analysis directly fuels your risk management. You aren't gambling; you are using the market's own structure—support, resistance, and consolidation zones—to build a trade with a positive expectancy.
This logic should be the foundation of every single trade you take. The visual clues on your OTC Charts MT4 interface are what bring the numbers in your risk calculation to life. It’s this critical link between seeing the pattern and defining the trade that separates disciplined traders from the crowd.
Finding Your Ideal Risk-Reward Profile
So, what's a "good" risk-to-reward ratio? Honestly, there's no magic number. A ratio that's perfect for a long-term, buy-and-hold investor could be disastrous for a scalper who's in and out of the market in minutes. The real key is finding a risk profile that actually fits your trading strategy and, just as importantly, your personality.
Many traders, myself included, often start with a benchmark of 1:2 or better. This simply means that for every dollar you're willing to lose, your goal is to make at least two dollars in profit.
Why is this a solid starting point? It boils down to simple math and sustainability. With a 1:2 ratio, you only need to be right more than 33% of the time to break even (not counting commissions). This creates a massive psychological buffer. It means you can have more losing trades than winning ones and still end up profitable. That’s a game-changer for staying consistent and avoiding the emotional rollercoaster of feeling like you have to win every single time.
Matching the Ratio to Your Trading Style
Your ideal risk-to-reward ratio is deeply tied to how you trade. A scalper hunting for tiny, rapid-fire profits will work with a completely different set of numbers than a swing trader holding a position for weeks.
Here’s a rough breakdown of how this looks in practice:
- Scalping: You might see lower ratios here, maybe even 1:0.7. The strategy relies on a very high win rate to make up for the smaller individual gains.
- Day Trading: Traders in this space often aim for a sweet spot between 1:1.5 and 1:3, which balances frequent opportunities with meaningful profit targets.
- Swing Trading: This demands much higher ratios, often 1:3 or even more. Since you're holding trades longer and tying up capital, the potential reward needs to justify that extended risk.
This isn't just a day trading concept; it applies to broader investing, too. Think about the classic 60/40 stock-and-bond portfolio. It's built on the idea of managing risk versus reward on a macro level. The diversified structure aims to smooth out the ride, historically offering stable returns and a more favorable risk-adjusted outcome, as firms like Vanguard have detailed for decades.
Ultimately, your job is to find a balance you can stick with. The ratio you choose has to work for your strategy and your own tolerance for risk. A great next step is learning how to spot trading opportunities that naturally set you up with these favorable risk profiles from the start.
Common Mistakes That Wreck Your Risk-Reward Ratio

Knowing the formula for risk-reward is one thing. Actually applying it under pressure is where most traders fail. It’s the subtle, emotion-driven mistakes that can completely unravel a solid trading plan. I’ve seen them happen time and time again.
The single most destructive error? Moving your stop-loss mid-trade.
You know the feeling. The market ticks against you, and your stop-loss feels dangerously close. The temptation to drag it down—just to give the trade a little more breathing room—is powerful. But the second you do that, you've completely voided your original risk-reward ratio. Your potential risk just ballooned, but your potential reward stayed the same. It's a classic rookie mistake that torpedoes your edge.
Forcing a Trade to Fit Your Ratio
Another common pitfall is fudging the numbers to make a trade look good. You might spot a setup that realistically offers a 1:1 risk-to-reward. To make it more appealing, you might arbitrarily set a much higher profit target, turning it into a 1:3 on paper.
This isn't analysis; it's wishful thinking. Your profit targets should always be grounded in reality—based on actual resistance levels, pivots, or other technical markers, not just where you wish the price would go.
A few other things to watch out for:
- Ignoring Costs: Forgetting to account for spreads and commissions is a slow bleed. These costs chip away at your profits and increase your real risk, skewing every calculation you make.
- Emotional Decisions: Letting fear or greed dictate your actions instead of your pre-defined plan.
Your pre-trade analysis is a contract with yourself. The discipline to honor your original stop-loss and take-profit is what separates amateurs from professionals. It's the bedrock of all effective trading risk management techniques.
This discipline isn’t just about individual trades; it’s a principle that works on a massive scale. A recent study of a $150 trillion global portfolio showed that properly diversified holdings had shorter, less painful drawdowns. This underscores a core truth: managing risk isn't just about avoiding losses, it's about fundamentally improving your long-term results. You can find more on how diversification plays a role in this in-depth financial study.
Common Questions About Risk-Reward Ratios
What's a Good Risk-Reward Ratio for Day Trading?
This is the million-dollar question, but the honest answer is: it depends entirely on your strategy and, more importantly, your win rate. There’s no magic number that works for everyone.
A scalper who wins 70% of their trades can be highly profitable with a ratio as low as 1:0.8. They're focused on small, frequent wins. On the other hand, a swing trader who holds positions longer and wins less often might need a ratio closer to 1:3 to make their strategy work. It all comes back to how often your trades are successful.
Does a High Risk-Reward Ratio Mean I'll Make Money?
Not by itself. A great ratio is only one piece of the puzzle. You could set up a trade with a fantastic 1:5 risk-to-reward potential, but if you only win 10% of those trades, you’ll drain your account over time.
A strong risk-reward ratio tells you that a trade is worth taking if you're right. It doesn't actually make you right more often. True profitability comes from combining a positive ratio with a solid, proven win rate.
How Should I Adjust My Ratio When the Market Gets Choppy?
Great traders are adaptable. When volatility spikes, you'll likely need to widen your stop-loss to avoid getting knocked out of a good trade by random market noise.
To maintain a healthy risk-reward balance, widening your stop means you must also push your profit target further out. This is where indicators like the Average True Range (ATR) come in handy. The ATR helps you set dynamic stops and targets based on current market conditions, not just arbitrary numbers, keeping your risk-reward ratio calculation relevant and effective.
Ready to stop guessing and start calculating your trades with professional precision? The OTC Charts MT4 module integrates seamlessly with your Pocket Option account, giving you the real-time data you need to define your risk and reward with confidence.