

Market sentiment analysis is all about taking the emotional temperature of the market. It’s not about digging through financial reports or staring at price charts; it’s about gauging the collective mood. Are investors feeling fearful or greedy? Optimistic or pessimistic?
Decoding the Market's Emotional Pulse
Think of it like this: if you were planning to open a new café, you wouldn't just analyze the building's rent (like fundamental analysis) or past foot traffic data (like technical analysis). You'd also walk around the neighborhood to get a feel for the "vibe." Are people excited about new places opening up? Is there a buzz in the air? That "vibe check" is precisely what market sentiment analysis provides for traders.
It’s built on a straightforward yet powerful idea: human emotions are a major force in the financial markets, not just cold, hard data. A company can report stellar earnings, but if widespread panic takes hold, its stock price can still plummet. On the flip side, a wave of collective hype can send an asset's price into the stratosphere, often with little fundamental justification.
The Three Pillars of Analysis
To really get a handle on market sentiment, it helps to see how it works alongside the two other main forms of analysis. Each one gives you a different lens for viewing the market. When you use all three together, the picture becomes much, much clearer.
Market sentiment provides the crucial 'why' that technical charts and fundamental reports often miss. It answers the question: "How do investors feel right now?" Understanding this feeling can be the key to anticipating market movements before they appear on a chart.
This approach involves looking at both direct data and more subjective information to build a complete picture.
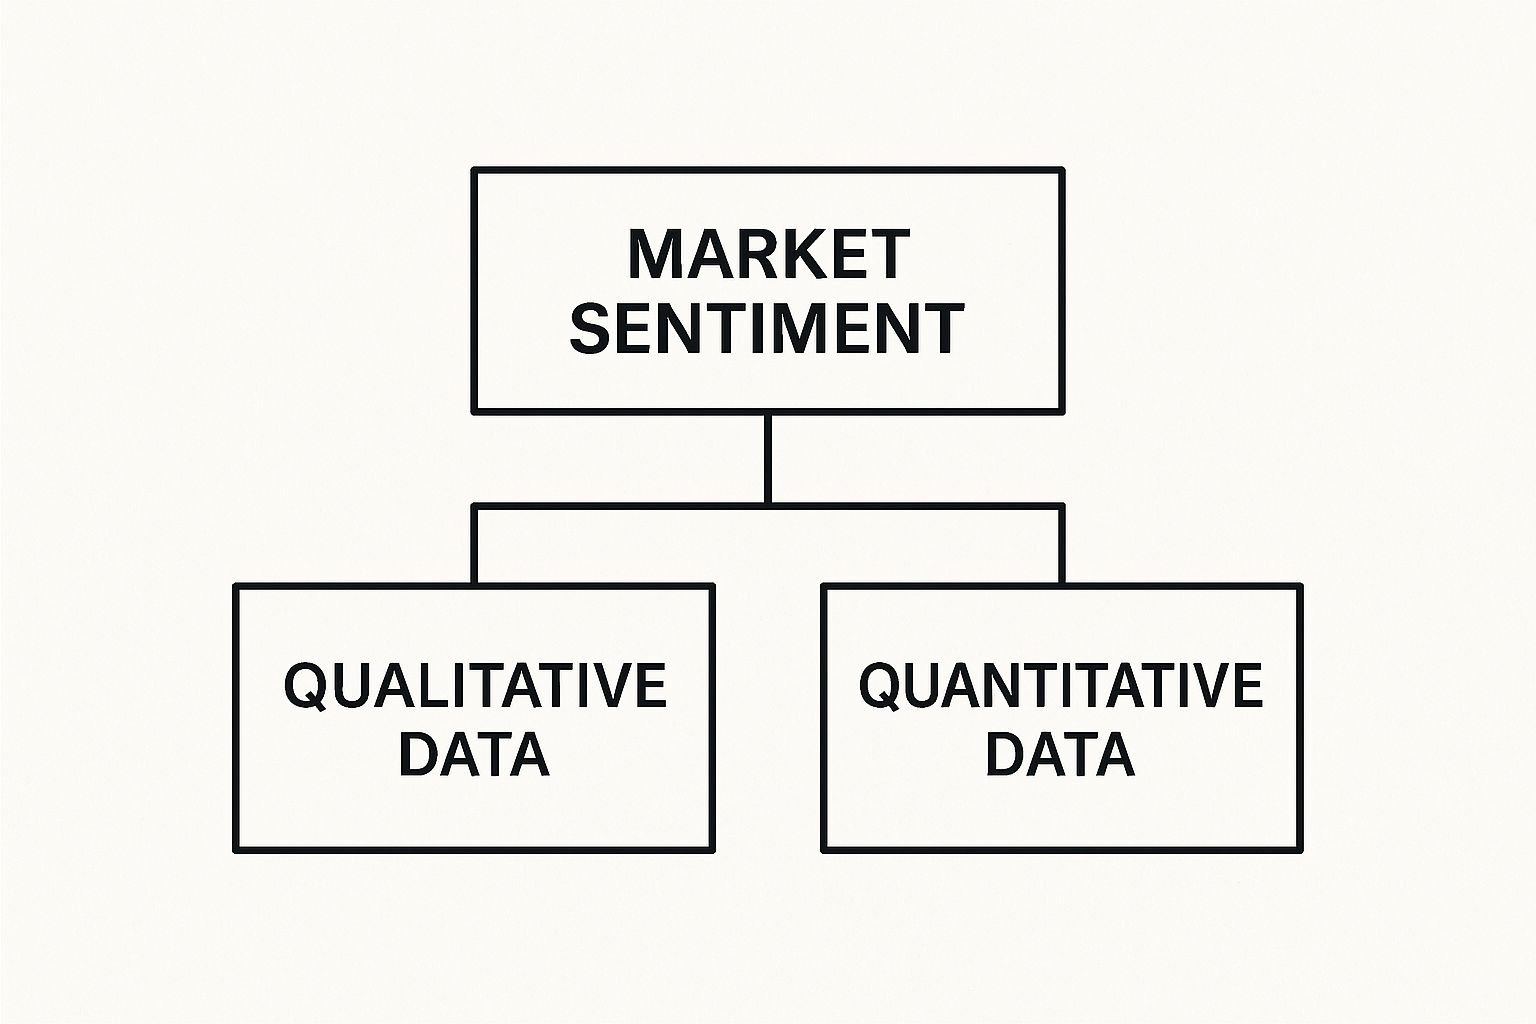
As the diagram shows, you can pull sentiment from qualitative sources like news headlines and social media chatter, but also from quantitative figures like trading volume. To put it all in context, let's compare the three core methods of analysis.
Three Pillars of Market Analysis Compared
This table breaks down how sentiment, technical, and fundamental analysis differ, showing the unique role each one plays.
| Analysis Type | What It Measures | Primary Tools | Key Question It Answers |
|---|---|---|---|
| Sentiment Analysis | The collective mood and psychology of market participants. | Social media trends, news analysis, VIX Index, Put/Call Ratio. | "How is the crowd feeling and what are they likely to do?" |
| Technical Analysis | Historical price action and trading volume. | Chart patterns, moving averages, RSI, MACD. | "Based on past price patterns, where might the price go next?" |
| Fundamental Analysis | The intrinsic, or "true," value of an asset. | Financial statements, P/E ratios, economic data, industry reports. | "Is this asset currently overvalued or undervalued?" |
Adding sentiment analysis to your toolkit means you aren't just trading on numbers and patterns; you're trading on human behavior. It gives you that third dimension, helping you confirm what your other analyses are telling you or—just as importantly—warning you when the market's emotional tide is about to turn against your position.
How to Decode the Market's Mood
Knowing that market mood matters is the easy part. The real challenge is actually measuring it. To get a real read on market sentiment, you need the right tools—ones that can translate the gut feelings of millions of traders into clear, actionable signals. These indicators are your emotional barometers, showing you whether fear or greed is in the driver's seat.
Let's walk through some of the most reliable and popular indicators out there. We'll start with the classic gauges that have stood the test of time and then move into the more modern, AI-powered methods. Each gives you a unique window into the market’s collective mind.
Classic Fear and Greed Indicators
Long before algorithms were sifting through tweets, traders had already figured out some clever ways to measure investor emotion. Two of the most enduring indicators come from the world of options trading and market volatility, giving you a direct look at how traders are placing their bets on the future.
The CBOE Volatility Index (VIX)
You’ll often hear the VIX called the "fear index," and for good reason. It essentially measures the market's expectation of turbulence over the next 30 days. Think of it as the market's collective heartbeat.
- A low VIX is like a slow, steady heartbeat. It suggests a calm, confident market where investors aren't scrambling to buy "insurance" (in the form of options) because they don't see a storm on the horizon.
- A high VIX is the opposite—a rapid, jumpy pulse. It signals rising anxiety and uncertainty. Traders are rushing to buy options to protect their portfolios, which is a classic sign of widespread fear about a potential drop.
When you see the VIX spike, it’s a powerful signal that fear is taking hold.
The Put/Call Ratio
This indicator gives you a more direct comparison of bullish versus bearish wagers. It simply compares the total number of traded put options (bets that an asset's price will fall) to call options (bets that it will rise).
A simple way to view the Put/Call Ratio: It's a tug-of-war between optimism (calls) and pessimism (puts). The ratio tells you which side is pulling harder at any given moment.
When the ratio climbs above 1.0, it means more people are buying puts than calls—a clear signal of rising bearish sentiment. On the flip side, a ratio dipping below 0.7 often means bullish optimism is the prevailing mood. It’s a beautifully simple number that gives you a powerful snapshot of what the market expects next.
The Modern Frontier: AI and Social Sentiment
The classic indicators are still incredibly useful, but today’s digital world has opened up a whole new, massively rich source of data: the internet itself. Every news article, every tweet, every Reddit forum post is a breadcrumb that can lead you to the market's true mood.
Of course, no human could possibly sift through that flood of information. That’s where Artificial Intelligence (AI) and Natural Language Processing (NLP) come in. These systems are built for the job. They can:
- Scan Millions of Sources: They monitor news sites, blogs, and social media platforms like Twitter and Reddit in real-time.
- Identify Keywords: They zero in on mentions of specific stocks, assets, or key market terms.
- Classify Emotion: This is the magic. The AI analyzes the language to determine if the sentiment is positive, negative, or neutral.
Imagine an AI scanning thousands of tweets mentioning a particular stock. If it detects a sudden surge in posts using words like "breakthrough," "soaring," and "must-buy," it will flag a strong positive sentiment score. This isn't just a vague feeling; it's a hard, quantifiable metric.
In fact, some studies have shown that modern NLP models can reach an accuracy of nearly 90% in classifying sentiment from social media text. This technology turns the chaotic noise of online chatter into a structured, measurable indicator that can often give you a heads-up on major market moves before they happen.
Tapping Into Social Media Sentiment
While classic indicators like the VIX give us a crucial, high-level view, they don't capture the raw, on-the-ground conversations that drive market behavior every single day. That's where social media comes in, completely changing the game for market sentiment analysis. Platforms like Twitter and Reddit have essentially become massive, real-time focus groups where millions of investors share their unfiltered opinions, hopes, and fears about specific stocks and the broader market.
Think of it like this: traditional data is the official press conference, but social media is where you can overhear what everyone really thinks in the cafeteria afterward. This unstructured chatter is an absolute goldmine for traders trying to understand the why behind a price move, not just the what.
Of course, trying to manually process this firehose of information is impossible. The sheer volume of posts, comments, and threads is just too much for any person to handle. This is where algorithms, specifically Natural Language Processing (NLP), step in to do the heavy lifting.
How NLP Translates Chatter Into Data
Natural Language Processing is a branch of AI that teaches computers to read and understand human language, nuance and all. When it comes to market sentiment, NLP algorithms are trained to do one thing very well: read a piece of text and assign it an emotional score.
These systems churn through millions of social media posts, news articles, and forum discussions in real-time. They’re programmed to spot keywords and contextual phrases that signal financial optimism or pessimism. It breaks down like this:
- Data Collection: First, the system scoops up any post mentioning a specific stock ticker (like $TSLA) or a market-related keyword (like "recession").
- Positive Scoring: The algorithm then scans each post for its emotional tone. It looks for words like "bullish," "breakout," and "soaring" to classify a post as positive.
- Negative Flagging: On the flip side, words like "crash," "bubble," and "disaster" will flag a post as negative. Anything without strong emotional language is simply marked neutral.
By adding up the scores from thousands or even millions of these individual posts, the system generates a clear, quantifiable sentiment score for an asset. It effectively turns the chaotic roar of the crowd into a measurable signal.
The real power of social media sentiment lies in its speed. It often captures a shift in public mood hours or even days before it's reflected in price charts or traditional market indicators, offering a valuable leading signal for traders.
The effectiveness of this approach isn't just theory; it's well-documented. Market sentiment analysis has shown real predictive power over stock market movements, especially when using social media data. With advanced NLP techniques, the accuracy of sentiment classification can climb to nearly 90%. Study after study has shown a clear link between the collective mood of investors on platforms like Twitter and Reddit and subsequent market price increases. You can explore more about the impact of social sentiment and see how researchers are applying these methods.
Blending Social Signals With Traditional Data
Social sentiment is a powerful tool, but it's at its best when it's not used in a vacuum. The sharpest traders don't just chase social buzz; they integrate it with traditional data points to build a more complete and reliable picture of the market. This creates a fantastic system of checks and balances for any trading decision.
Picture this scenario:
- Fundamental Analysis shows a company has rock-solid earnings.
- Technical Analysis reveals the stock is in a clear, strong uptrend.
- Social Sentiment Analysis shows a massive, sustained surge in positive conversations about the company's hot new product launch.
When all three pillars of analysis line up, you've got a much higher-confidence trading signal. The social sentiment acts as the final confirmation, showing you that real-world excitement is backing up the numbers on the screen. That’s a powerful edge to have.
So, Does This Stuff Actually Work?
Let's get straight to the point. For any trader, this is the million-dollar question. It’s all well and good to talk about crowd psychology and theories, but does market sentiment analysis give you a real, tangible edge? Can it actually help you predict where the market is going?
The answer, which is now backed by a ton of statistical evidence, is a resounding yes.
This isn't about trading on a hunch. The whole idea is grounded in data, revealing that major shifts in public mood often happen before the market price catches up. This is what makes sentiment a powerful leading indicator. It offers a sneak peek at potential price moves, instead of just telling you what already happened.
Think of it like seeing storm clouds gathering on the horizon. A meteorologist doesn't wait for the rain to start pouring to tell you to grab an umbrella. They look at atmospheric pressure and wind patterns to see the storm coming. In the same way, sentiment analysis lets you see the market's "emotional pressure" building before the price storm actually hits.
The Proof Is in the Numbers
To move past analogies, let's look at how researchers have tested this. Two key concepts really drive home the validity of sentiment analysis: correlation and causality.
- Correlation is simple: Do two things tend to move together? For example, when positive chatter about a stock on social media increases, does its price also go up?
- Causality digs deeper: Does a change in one thing cause a change in the other? This is the one that really matters to us as traders.
If sentiment just moves in lockstep with price, it's an interesting footnote but not very helpful for forecasting. But if a change in sentiment consistently happens before a price move, you've established causality. That’s when it becomes an incredible predictive tool. And that's exactly what countless quantitative studies have confirmed.
The core takeaway here is that sentiment isn't just a mirror reflecting current prices; it’s often a crystal ball showing future prices. This predictive power is what turns it from a neat metric into a strategic weapon, giving you a serious advantage in timing your entries and exits.
This predictive link shows up again and again, especially when you start digging into the massive amounts of data from social media platforms.
From Tweets to Trades: Proving the Causal Link
Quantitative studies have put market sentiment under a powerful microscope, and the results are pretty compelling. Researchers have repeatedly validated its use for forecasting stock prices, especially when using data scraped from platforms like Twitter. They use advanced statistical tools like the Pearson correlation coefficient and Granger causality tests to prove the connection between online mood and market returns.
When applied to stock data, these Granger causality tests have shown incredibly significant results over several days. What they demonstrate is that shifts in public emotion, as measured online, reliably come before shifts in stock prices. This isn't just a fluke or a random coincidence; it's a statistically proven pattern. You can dive deeper into these statistical findings to see the raw data for yourself.
This evidence confirms that tracking the market's collective gut feeling isn't just a gimmick—it's a data-driven strategy. It shows that by the time a big news story breaks, the digital "whispers" on social media have already given you a clue about where things are probably headed. For a trader, learning to listen to those whispers provides a powerful, statistically-backed edge. That's the real power of market sentiment analysis.
Practical Tools for Tracking Sentiment
It’s one thing to understand the theory behind market sentiment, but the real magic happens when you can actually measure it. Turning the abstract idea of "crowd psychology" into hard data you can use is what separates successful traders from the rest. The good news? You don't need a Wall Street budget to get started.
Plenty of accessible tools can help you translate market mood into tangible insights for your trading strategy. This is where you stop being a spectator and start learning to tell the difference between a fleeting social media fad and a real, sustainable trend. Let's dig into some of the most effective options out there, starting with one of the simplest yet most powerful: Google Trends.
Using Google Trends to Gauge Public Interest
Think of Google Trends as a free, real-time barometer of public curiosity. It shows you exactly how often people are searching for a specific term, giving you a crystal-clear picture of whether interest is heating up or cooling down. For a trader, this is an incredible way to see if a stock, asset, or economic topic is capturing the public's attention.
Here's how you can put it to work:
- Track Specific Stocks: Just type in a company's name or stock ticker. A sudden, sharp spike in search volume is a huge red flag that something is going on—a major news story, an earnings surprise, or a viral social media discussion.
- Compare Multiple Assets: Pit a few stocks or cryptocurrencies against each other. This is a great way to see which asset is winning the popularity contest and has the most momentum at any given moment.
- Identify Market Themes: Go broader. Search for terms like "recession fears," "AI stocks," or "housing market crash." A steady climb in these searches can signal a major shift in the economic mood that could ripple across your entire portfolio.
For example, take a look at this screenshot from Google Trends showing search interest for a topic over time.
A spike like that almost always lines up with a significant event, telling you that the topic has officially gone mainstream. This kind of visual data can act as a powerful early warning system for a jump in volatility or a change in market direction.
Time and again, historical data shows that spikes in what investors are searching for often happen right before or during major stock price moves. It’s a clear confirmation that real-time sentiment matters. For more examples, you can find out how real-time tools track market sentiment on strikingly.com.
Beyond Google: Integrated Sentiment Platforms
Google Trends is fantastic for gauging general public interest, but other platforms are built specifically for traders. They take a more direct approach by pulling news, social media chatter, and search data into a single, unified dashboard.
The whole point of these platforms is to cut through the noise. Instead of jumping between news sites, Twitter, and search engines, you get one aggregated sentiment score that tells you the story at a glance.
These specialized platforms often provide:
- Real-Time News Analysis: They scan thousands of articles and press releases, using algorithms to score the language and determine if the overall coverage is positive or negative.
- Social Media Monitoring: They keep a finger on the pulse of platforms like X (formerly Twitter) and Reddit, measuring the emotional tone of the conversation around an asset.
- Intuitive Dashboards: All this data is presented in easy-to-read charts and gauges, showing you sentiment scores and how they're trending over time.
While these tools give you a powerful edge, they work best when you have solid analytical skills to back them up. If you're new to reading charts, it’s crucial to get the fundamentals down first. Our guide on technical analysis for beginners is a great place to build that foundation. Ultimately, these tools are about adding another layer to your analysis—a crucial emotional context that can make all the difference in your daily trading decisions.
Integrating Sentiment Into Your Trading Strategy

It’s one thing to understand the theories and tools of market sentiment, but the real magic happens when you start weaving those insights into your actual trading. This is where you graduate from simply watching the market to actively using its emotional temperature to your advantage. Sentiment analysis isn't a standalone crystal ball; think of it as a powerful booster for the strategy you already use.
I like to think of it as adding a third dimension to my analysis. Technicals show me what the price is doing on a chart. Fundamentals help explain why an asset has its current value. But sentiment analysis adds the crucial layer of how the crowd is feeling and reacting. This gives you a powerful confirmation for your trade ideas—or a critical warning to stay away.
A Framework for Integration
The goal here isn't to replace what works for you, but to add a system of checks and balances. You want to use sentiment to either strengthen your conviction in a trade or make you pause and think twice. It’s your best defense against getting caught up in the market's emotional rollercoasters.
A practical way to put this into action involves a straightforward process:
- Start with Your Core Analysis: Begin with your go-to method, whether that's spotting patterns on a chart or digging into an asset's fundamentals. This is what forms your initial trade idea.
- Add the Sentiment Layer: Now, bring in the sentiment data. Is the VIX nice and calm, or is it spiking with fear? Is the chatter around your target asset on social media overwhelmingly positive, or is it souring?
- Look for Convergence or Divergence: This is the most important step. Does the sentiment you're seeing back up your initial analysis, or does it tell a completely different story?
When your technical or fundamental analysis aligns with market sentiment, it can significantly tilt the odds in your favor. But when they clash, that’s your cue to be extra careful.
The biggest mistake I see traders make is falling victim to confirmation bias—they only seek out information that validates what they already believe. True sentiment analysis forces you to look at the other side of the coin, giving you a more complete and objective picture before you risk your capital.
This disciplined approach helps ground your decisions in reality, preventing you from getting swept away by irrational hype or panic.
A Real-World Trading Scenario
Let’s walk through how this might play out. Imagine a company you follow is about to release its quarterly earnings report.
Your fundamental work suggests the company is solid and will likely beat analyst expectations. On the charts, the technicals look good too—the stock is in a clear uptrend, though it’s nearing a key resistance level. Based on this, you’re thinking about going long.
Now, you add that sentiment layer. You check the news and social media, and the mood is euphoric. Everyone seems to be expecting a massive beat. While that sounds great, an experienced trader sees a red flag. Extreme optimism often means the good news is already "priced in" by the market.
Instead of just blindly buying, the sentiment analysis makes you smarter. You might decide to:
- Wait for the actual earnings release to see how the market truly reacts.
- Take a smaller-than-usual position to limit your risk if the stock sells off on the "good" news.
- Set a much tighter stop-loss to protect your capital from a quick reversal.
In this scenario, sentiment didn't predict the future. It highlighted a hidden risk: the danger of buying at the absolute peak of market hype. It gave your decision-making process crucial emotional context.
Using this data is also vital for managing your open trades. Understanding the market’s mood can help you set more realistic profit targets and stop-losses, which is fundamental to maintaining a healthy risk-to-reward ratio. To get this right, check out our complete guide on risk-reward ratio calculation and master this essential skill. At the end of the day, that's what sentiment analysis is all about—stacking the probabilities in your favor.
Frequently Asked Questions About Market Sentiment
As you start working with market sentiment analysis, you're bound to have some questions. It's a powerful way to look at the markets, but it definitely brings up some new ideas that can feel a little complex at first. Let's tackle some of the most common questions to clear the air and help you use these concepts with more confidence.
Is Sentiment Analysis Better Than Other Methods?
This is a great question, and one I hear all the time. The short answer is no, it's not better—it's a critical third piece of the puzzle, right alongside technical and fundamental analysis. The most successful traders don't pick one; they weave all three together into a single, robust strategy.
Here’s a simple way to think about it:
- Technical Analysis shows you what the price is doing on a chart.
- Fundamental Analysis tries to figure out what an asset should be worth based on its underlying value.
- Sentiment Analysis reveals how the crowd feels about that asset, which often drives short-term price action.
When you use them together, you get a much richer, more complete picture of the market. You can use sentiment to confirm a breakout spotted on a chart or to understand why a fundamentally strong asset is suddenly selling off.
How Reliable Is Social Media Sentiment?
Social media platforms are a goldmine for sentiment data, but you have to know how to sift through the noise. It's a firehose of opinions, and a lot of it is just that—noise. While modern AI has gotten incredibly good at parsing this data, the real skill is in spotting broad, sustained trends instead of overreacting to a single viral tweet.
The biggest mistake traders make is seeing one topic trending and immediately treating it as a buy or sell signal. Think of social media sentiment as a barometer for the market's emotional temperature, not as a crystal ball.
Use it to get a feel for the prevailing mood. When that mood aligns with your other analysis, that's when it becomes truly powerful.
Can Small Retail Traders Really Benefit?
Absolutely. Not too long ago, this kind of deep-dive analysis was the exclusive domain of big hedge funds and financial institutions with armies of analysts. That's just not the case anymore. New, accessible tools have leveled the playing field, giving any trader the ability to tap into this data and find a real edge.
When you understand the emotional currents driving the market, you're less likely to get caught in a speculative frenzy or panic-sell at the bottom. It gives you the power to see what the "crowd" is thinking and feeling, which leads to much smarter decisions. Over time, keeping a consistent pulse on these emotional waves can make a real difference in your bottom line, something you can track with your trading performance metrics.
If there's one thing to remember, it's this: sentiment is just a measure of mood, and moods can shift in an instant. Never, ever rely on one indicator alone. Always use sentiment analysis as part of a well-rounded strategy, backed by solid risk management and confirmed by other forms of analysis.
At OTC Charts MT4, we provide the precision tools you need to integrate sophisticated analysis into your Pocket Option trading. Gain a competitive edge with real-time, professional-grade OTC charting directly in your MT4 platform. Elevate your trading strategy today at otc-charts-mt4.com.