

Welcome to the definitive guide on elevating your trading game on Pocket Option. In the fast-paced world of binary options, having a generic approach is a surefire way to deplete your account. A well-defined, tested, and precisely executed pocket option strategy is the line between guessing and making calculated, profitable decisions. This article moves beyond vague tips, providing a comprehensive roundup of seven powerful strategies used by seasoned traders.
We'll dissect each method's core logic, detailing specific entry and exit rules alongside essential risk management protocols. You will learn not just the what but the how for strategies like the Pin Bar, Bollinger Bands Squeeze, and RSI Divergence.
Crucially, we'll explain how to gain a significant edge by integrating real-time, professional-grade OTC data from tools like OTC Charts MT4. This transforms theoretical knowledge into a potent, actionable trading plan. Whether you're a beginner seeking structure or an experienced trader refining your methods, these blueprints are designed to provide the clarity and precision needed to navigate the markets effectively, especially during after-hours and weekend OTC sessions. This guide is your next step toward trading with confidence and consistency.
1. Pin Bar Strategy
The Pin Bar strategy is a cornerstone of price action trading, revered for its simplicity and effectiveness in identifying potential market reversals. This powerful candlestick pattern signals that a particular price level has been tested and rejected, suggesting the market is poised to move in the opposite direction. For anyone looking for a reliable pocket option strategy, mastering the pin bar is an excellent starting point.
A pin bar is characterized by its long upper or lower tail (also called a "wick" or "shadow") and a small real body. The long tail shows where the price attempted to go but was forcefully pushed back by opposing pressure. This rejection is the key signal.
How It Works: Entry and Exit Rules
The core of this strategy involves identifying pin bars at significant support or resistance levels. These are areas where the price has previously reversed, making a rejection signal even more potent.
- Bullish Reversal (CALL Option): Look for a pin bar with a long lower tail (a "hammer") forming at a key support level. This indicates that sellers tried to push the price down but were overpowered by buyers. You would enter a CALL option shortly after the pin bar closes.
- Bearish Reversal (PUT Option): Identify a pin bar with a long upper tail (a "shooting star") at a major resistance level. This shows that buyers failed to sustain the upward momentum, and sellers took control. This is a signal to enter a PUT option.
Example Scenario: Imagine the EUR/USD pair is approaching a daily resistance level on your Pocket Option chart. A candlestick forms with a small body at the bottom and a very long upper wick that pierces the resistance level before closing back below it. This is a classic bearish pin bar, signaling a strong rejection. A trader using this strategy would confidently place a PUT option, anticipating the price will fall.
This infographic summarizes the essential characteristics of a valid pin bar.
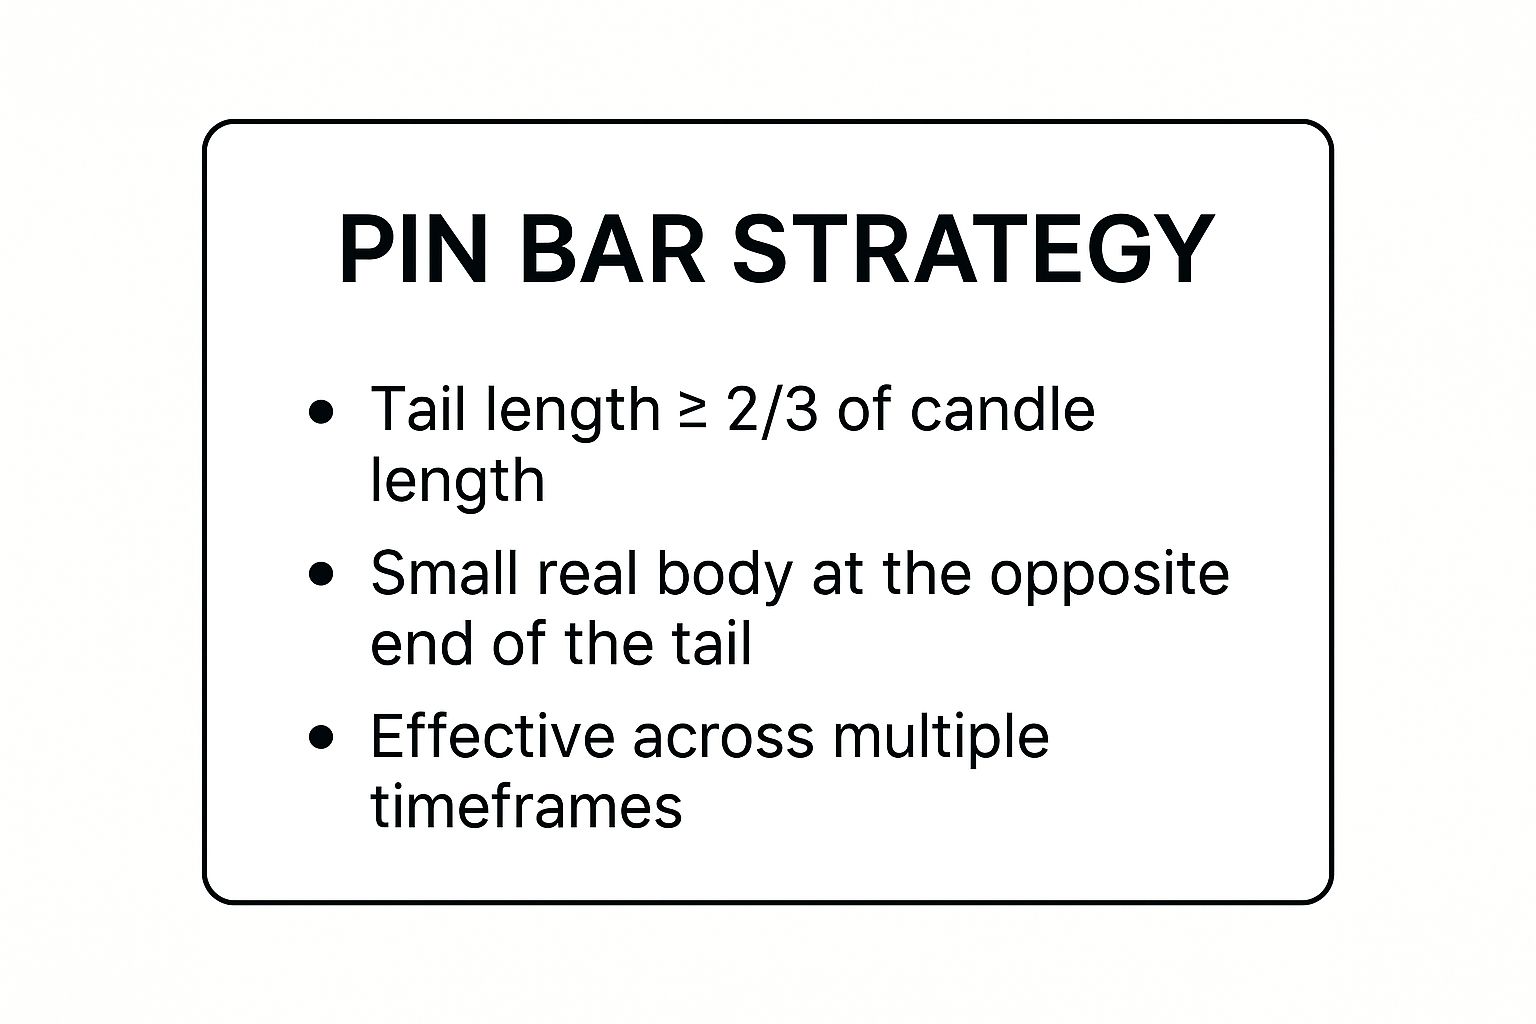
These visual cues help you quickly validate a pattern, ensuring the rejection signal is strong and not just random market noise.
2. Bollinger Bands Squeeze Strategy
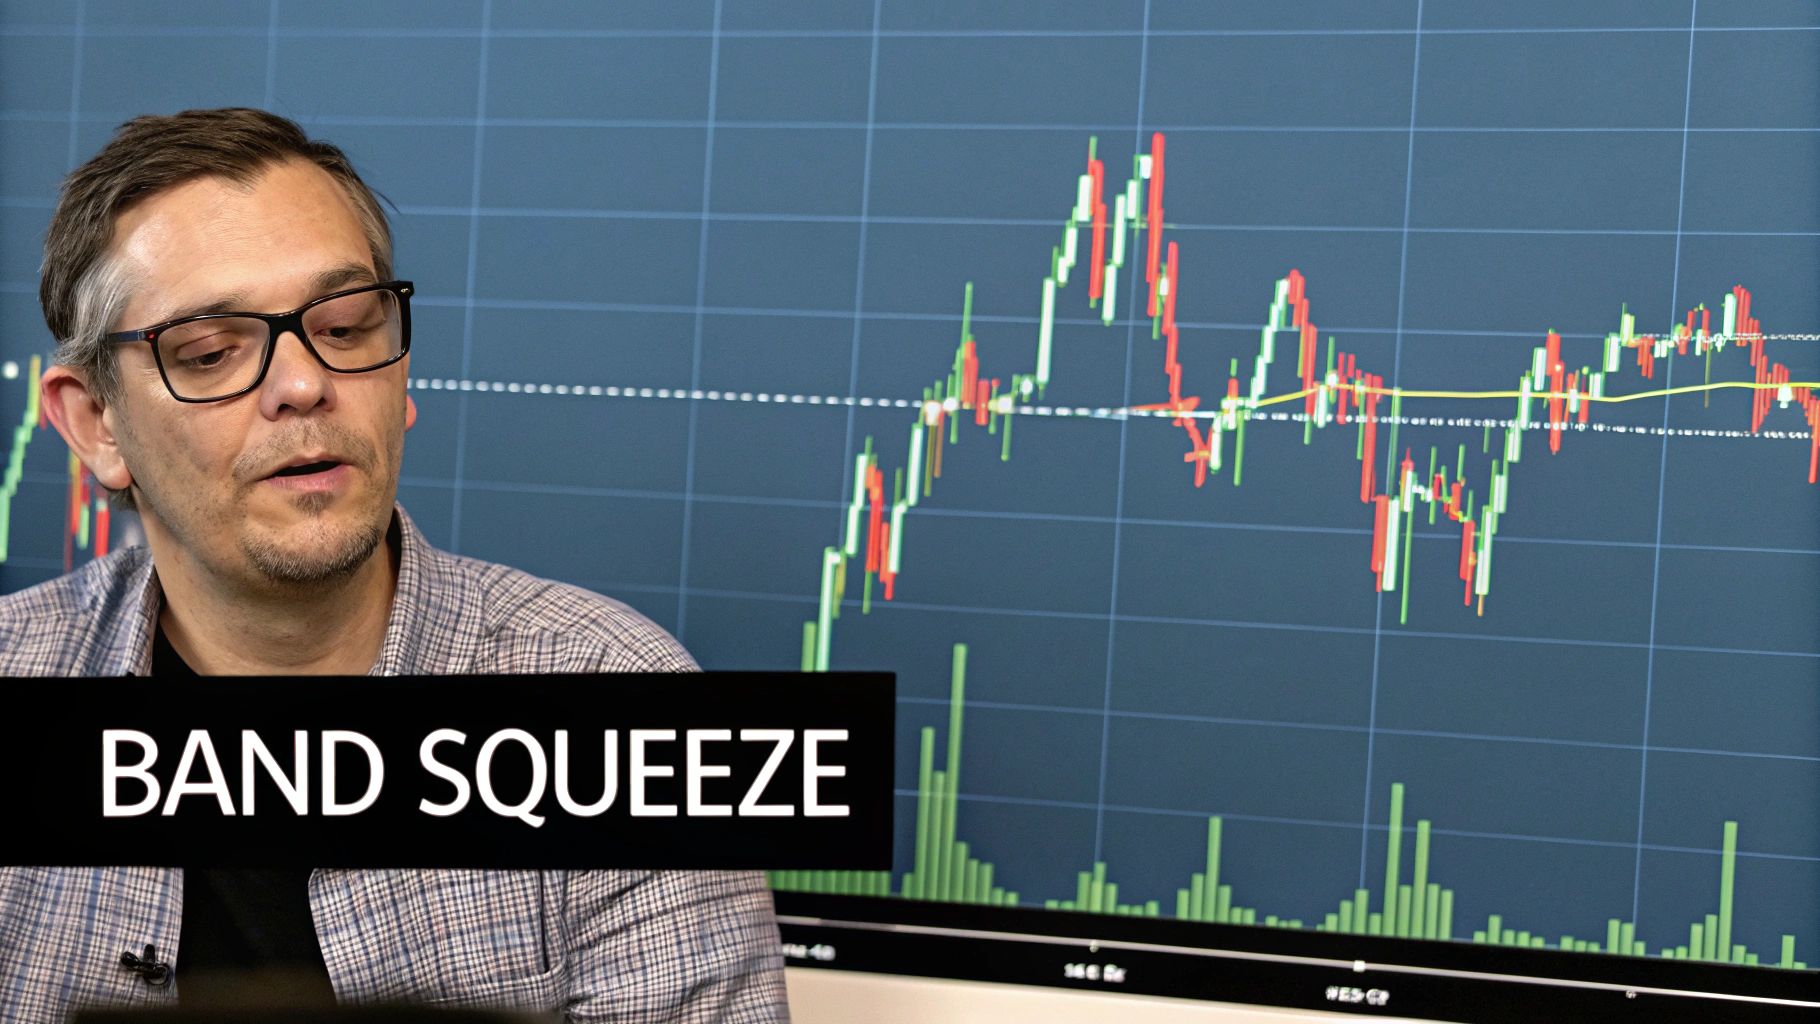
The Bollinger Bands Squeeze strategy is a powerful volatility-based approach that capitalizes on the market's natural rhythm of alternating between low and high volatility. Developed by John Bollinger, this strategy identifies periods when the market is consolidating quietly (the "squeeze") just before an explosive price movement. For traders seeking a proactive pocket option strategy, the Bollinger Bands Squeeze offers a way to anticipate and trade breakouts.
This strategy revolves around the Bollinger Bands indicator, which consists of a middle band (a simple moving average) and two outer bands representing standard deviations. When the outer bands contract and move closer together, it signals that volatility is decreasing, coiling up like a spring. The subsequent expansion of the bands often indicates a significant price breakout.
How It Works: Entry and Exit Rules
The core principle is to wait for the squeeze and then trade the direction of the breakout. This method helps traders avoid choppy, directionless markets and enter when momentum is building.
- Bullish Breakout (CALL Option): First, identify a "squeeze" where the Bollinger Bands are exceptionally narrow. Wait for a candlestick to close decisively above the upper band. This signals that buyers have taken control and a strong upward move is likely. You would enter a CALL option on the breakout candle's close.
- Bearish Breakout (PUT Option): Similarly, find a period of low volatility indicated by contracting bands. Wait for a candlestick to close firmly below the lower band. This suggests sellers have overwhelmed buyers, and the price is poised to fall. This is your signal to enter a PUT option.
Example Scenario: On the GBP/JPY 4-hour chart in Pocket Option, you notice the Bollinger Bands have become very tight over several candles, indicating a squeeze. Suddenly, a large bearish candle forms and closes well below the lower band. This breakout confirms that selling pressure has been released. A trader using this strategy would confidently place a PUT option, setting an expiry time long enough to capture the expected downward momentum. Using a volume indicator can further validate the breakout's strength.
3. RSI Divergence Strategy
The RSI Divergence strategy is a sophisticated technique that leverages the Relative Strength Index (RSI) to spot weakening momentum and predict high-probability market reversals. Unlike strategies that simply react to price, this method identifies a disconnect between price action and the RSI indicator. This divergence is a powerful leading signal, making it an essential pocket option strategy for traders who want to anticipate market turns before they happen.
Divergence occurs when the price of an asset is moving in one direction while the RSI is moving in the opposite direction. This discrepancy suggests that the underlying momentum driving the current price trend is fading, often preceding a significant reversal.
How It Works: Entry and Exit Rules
This strategy involves comparing the highs and lows of the price chart with the highs and lows on the RSI indicator. The key is to find situations where they do not confirm each other.
- Bullish Divergence (CALL Option): This occurs in a downtrend. The price chart forms a new lower low, but the RSI indicator forms a higher low. This signals that selling pressure is weakening, and an upward reversal is likely. You would prepare to enter a CALL option once the price action confirms a bottom.
- Bearish Divergence (PUT Option): This appears in an uptrend. The price chart creates a new higher high, but the RSI makes a lower high. This indicates that buying momentum is running out of steam and a downward correction is imminent. This is a strong signal to enter a PUT option.
Example Scenario: Consider the Gold (XAU/USD) chart showing a steady downtrend. The price drops to a new significant low, but when you look at the RSI indicator below, you notice it has formed a higher low compared to its previous trough. This classic bullish divergence signals that the downtrend is losing its power. A trader using this strategy would wait for a confirmation candlestick and then place a CALL option, correctly anticipating a price bounce.
This proactive approach allows you to enter trades at the very beginning of a new move, maximizing potential profit. Combining RSI divergence with key support and resistance levels adds an extra layer of confirmation, turning a good signal into a great one.
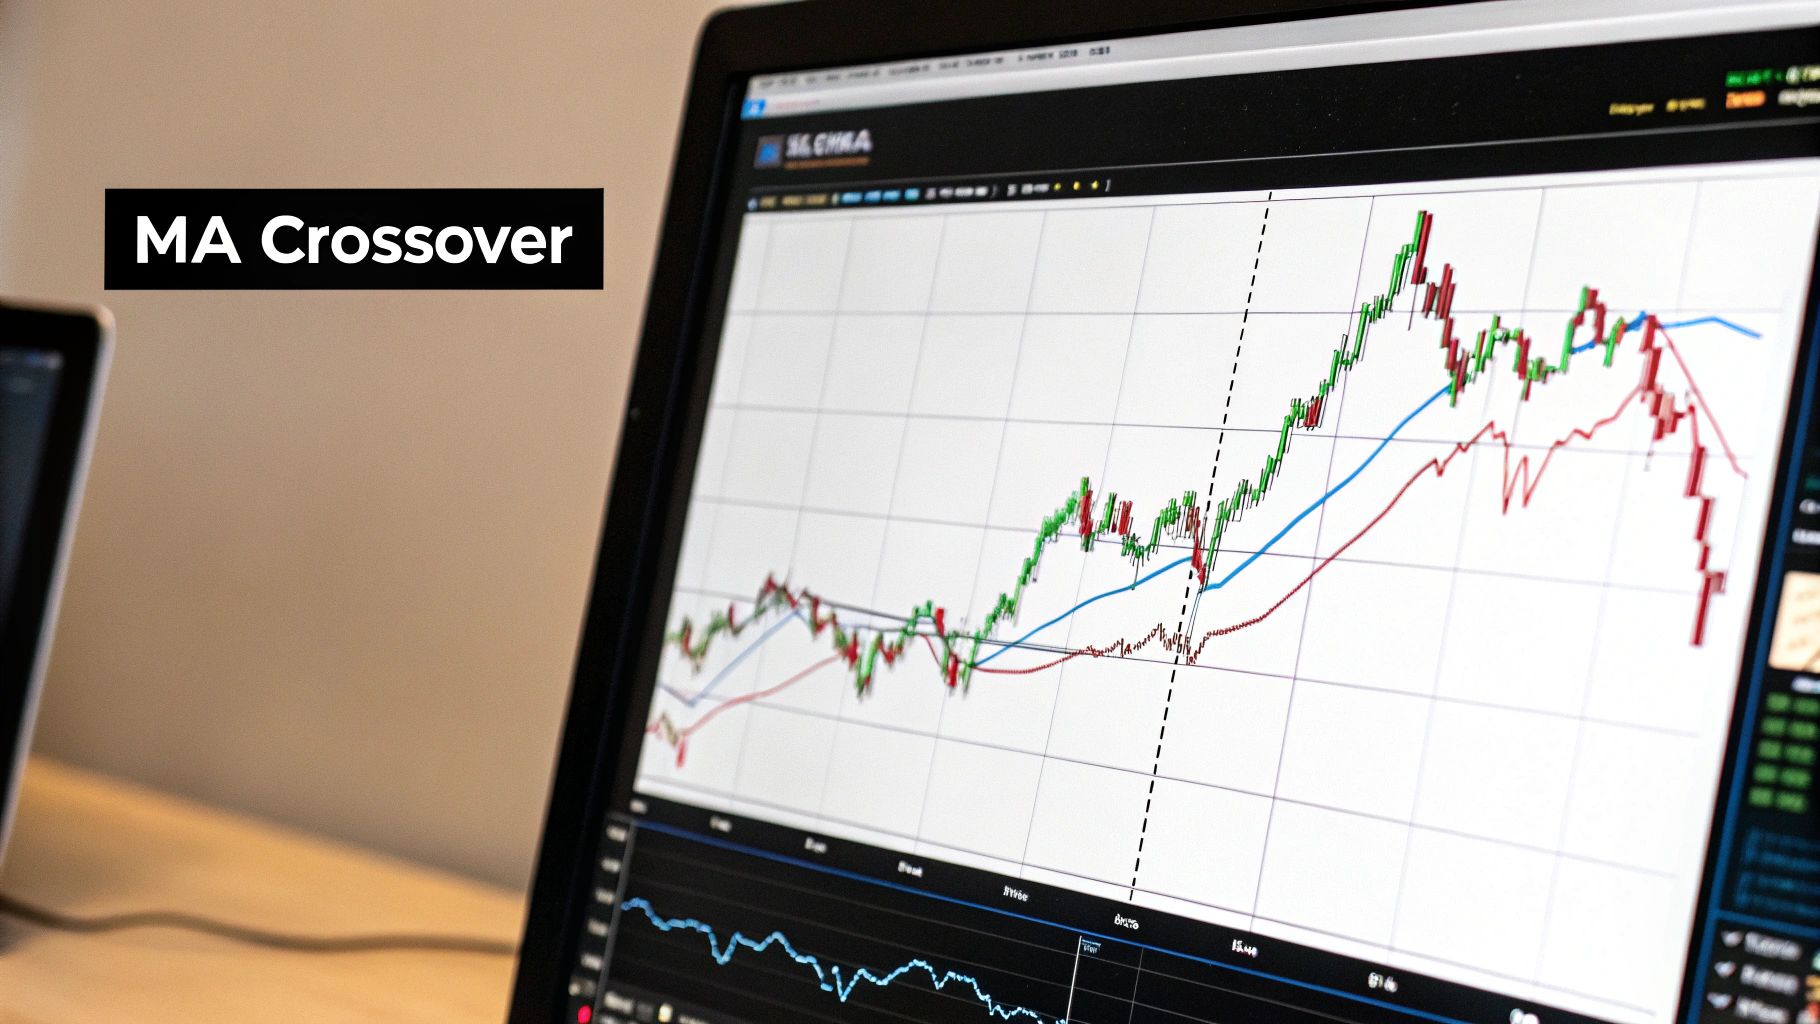
4. Moving Average Crossover Strategy
The Moving Average (MA) Crossover is a classic trend-following strategy that helps traders identify the momentum and direction of the market. By plotting two different moving averages on a chart, traders can pinpoint potential entry and exit signals based on when the lines intersect. This makes it an incredibly popular and visual pocket option strategy, especially for those who prefer clear, objective signals over subjective pattern interpretation.
The strategy relies on a "faster" moving average (e.g., a 10-period MA) and a "slower" moving average (e.g., a 30-period MA). The crossover event signals a potential shift in market momentum.
How It Works: Entry and Exit Rules
The logic behind this strategy is straightforward: when short-term momentum overtakes long-term momentum, a new trend may be starting. This is particularly effective in trending markets, including weekends when trading over-the-counter assets. For those interested, you can learn more about how these indicators perform when trading OTC markets.
- Bullish Crossover (CALL Option): This occurs when the faster moving average crosses above the slower moving average. This event, often called a "golden cross," suggests that buying pressure is increasing and an uptrend is likely to form. You would enter a CALL option after the crossover is confirmed.
- Bearish Crossover (PUT Option): This happens when the faster moving average crosses below the slower moving average. Known as a "death cross," this indicates that selling pressure is gaining strength and a downtrend may be imminent. This is your signal to place a PUT option.
Example Scenario: On the S&P 500 chart, you notice the 50-day exponential moving average (EMA) has just crossed above the 200-day EMA. This is a significant golden cross, often heralding a major bull market run. A trader using this strategy on Pocket Option would look for opportunities to place CALL options, aligning their trades with the newly established long-term bullish momentum.
Using Exponential Moving Averages (EMAs) is often preferred as they react more quickly to recent price changes, providing earlier signals compared to Simple Moving Averages (SMAs). However, this also means they can be more susceptible to false signals in choppy, non-trending markets.
5. Support and Resistance Bounce Strategy
The Support and Resistance Bounce Strategy is a foundational price action technique that focuses on trading reversals from well-defined horizontal levels. These levels act as powerful "floors" (support) and "ceilings" (resistance) where the price has historically struggled to break through. For traders seeking a logical and repeatable pocket option strategy, identifying and trading these bounces offers a clear framework for making decisions.
This method, championed by legendary traders like Jesse Livermore and central to Dow Theory, relies on the principle that past price behavior often predicts future movements. When a price approaches a strong support or resistance zone, it's more likely to reverse than to break through, creating high-probability trading opportunities. The strength of these levels is often confirmed by multiple previous "touches" or rejections.

How It Works: Entry and Exit Rules
The strategy is straightforward: you identify a significant level and wait for the price to approach it, then enter a trade in the opposite direction once a bounce is confirmed. To enhance accuracy, especially with after-hours assets, you can use real-time OTC quotes from an MT4 feed to validate these key price levels.
- Trading a Bounce off Support (CALL Option): Draw a horizontal line at a price level where the market has previously reversed upwards multiple times. When the price falls to this support level and shows signs of rejection (e.g., forming a bullish candlestick), you would enter a CALL option, anticipating a bounce higher.
- Trading a Bounce off Resistance (PUT Option): Identify a price ceiling where upward moves have consistently stalled. As the price rises to this resistance level and fails to break through, you would enter a PUT option, predicting that the price will be pushed back down.
Example Scenario: Consider the Gold (XAU/USD) chart, where the price has repeatedly failed to close above the $1,800 level over several days. This establishes $1,800 as a strong resistance zone. A trader using this strategy would watch for the price to test this level again. If it reaches $1,800 and a bearish candlestick pattern forms, they would confidently place a PUT option, expecting the price to fall away from the resistance. The key is to wait for the bounce confirmation rather than preemptively placing the trade.
6. Stochastic Oscillator Strategy
The Stochastic Oscillator is a momentum indicator that compares a particular closing price of an asset to a range of its prices over a certain period of time. Developed by George Lane, this tool is exceptional at identifying overbought and oversold conditions, making it a highly effective pocket option strategy for traders looking to capitalize on potential market reversals or continuations within a trend.
This indicator operates on a scale from 0 to 100. When the oscillator line rises above 80, the asset is considered "overbought" and may be due for a price drop. Conversely, when it falls below 20, the asset is deemed "oversold," suggesting a potential price bounce. This clear signaling removes much of the guesswork from timing your trades.
How It Works: Entry and Exit Rules
The core of this strategy lies in reacting to the Stochastic Oscillator's position relative to the 20 and 80 levels, often confirmed by a crossover of its two lines (%K and %D).
- Bullish Reversal (CALL Option): Wait for the oscillator to dip below the 20 level, indicating oversold conditions. The entry signal strengthens when the main line (%K) crosses back up over the signal line (%D) while still in the oversold zone. This suggests momentum is shifting upward, providing a good moment to place a CALL option.
- Bearish Reversal (PUT Option): Look for the oscillator to move above the 80 level, signaling an overbought market. An ideal entry signal occurs when the %K line crosses below the %D line within this overbought area. This bearish crossover indicates that buying pressure is fading, presenting an opportunity to enter a PUT option.
Example Scenario: On the Pocket Option platform, you observe the GBP/USD pair in a sideways market. The Stochastic Oscillator on your chart drops below the 20 mark. Shortly after, the faster %K line crosses above the slower %D line. This bullish crossover in the oversold territory is a classic signal that the price is likely to rise. A trader using this strategy would confidently place a CALL option, anticipating a short-term upward bounce.
7. News Trading Strategy
The News Trading Strategy moves away from technical chart patterns and focuses on fundamental analysis, capitalizing on the market volatility generated by major economic news releases. This approach is powerful because significant news, like interest rate decisions or employment reports, can cause sharp, predictable price movements in a very short time. For traders who want a pocket option strategy that is event-driven, this is a highly effective method.
This strategy hinges on understanding which economic events will impact specific assets. The market's reaction to news is often swift and strong, creating clear opportunities for binary options traders to profit from the resulting volatility.
How It Works: Entry and Exit Rules
The core of this strategy involves using an economic calendar to identify high-impact news events and then trading the immediate aftermath. You are not trying to predict the news itself, but rather reacting to the market's response once the data is released.
- Positive News (CALL Option): If a major economic report, like the Non-Farm Payroll (NFP) in the U.S., comes out much better than expected, it is typically bullish for the US Dollar. A trader would quickly enter a CALL option on a pair like USD/JPY, anticipating the USD will strengthen.
- Negative News (PUT Option): Conversely, if the European Central Bank (ECB) signals a more dovish monetary policy than anticipated, this is bearish for the Euro. This would be a clear signal to place a PUT option on the EUR/USD pair, expecting its value to fall.
Example Scenario: You are monitoring the economic calendar and see that the Bank of Canada is set to announce its overnight interest rate. Analysts expect no change, but the bank unexpectedly raises the rate by 0.25%. This is a highly bullish event for the Canadian Dollar (CAD). A news trader would immediately execute a CALL option on the USD/CAD (anticipating it to fall, meaning CAD is strengthening) or a CALL on CAD/JPY, predicting a rapid upward surge in price. The key is speed and decisiveness.
Key Tip: The most intense price movements often occur within the first 15-30 minutes of a major news release. Using shorter expiry times (e.g., 5-15 minutes) is often more effective for this strategy to capture the initial price shock.
While many news events happen during standard market hours, some high-impact announcements can affect assets traded over the weekend. Understanding these timelines is crucial for preparation. You can learn more about OTC market trading hours to better align your strategy with round-the-clock opportunities.
Pocket Option Strategy Comparison Table
| Strategy | Implementation Complexity 🔄 | Resource Requirements ⚡ | Expected Outcomes 📊 | Ideal Use Cases 💡 | Key Advantages ⭐ |
|---|---|---|---|---|---|
| Pin Bar Strategy | Low – easy visual identification | Low – mainly chart analysis | Moderate – good probability reversals | Trending and ranging markets | Clear signals, works across timeframes |
| Bollinger Bands Squeeze Strategy | Medium – requires understanding volatility and band behavior | Medium – uses indicators and volume | High – captures large breakout moves | Low volatility periods before big moves | High profit potential, clear signals |
| RSI Divergence Strategy | Medium to high – requires experience to spot divergences | Low to medium – uses RSI indicator | Moderate – early reversal signals | Overbought/oversold, ranging markets | Early warning, avoids false breakouts |
| Moving Average Crossover Strategy | Low – simple MA crossover identification | Low – two moving averages | Moderate – trend-following signals | Trending markets | Clear signals, reduces noise |
| Support and Resistance Bounce Strategy | Low – straightforward level identification | Low – price action analysis | Moderate – high probability bounces | Trending and ranging markets | Clear risk management, easy to identify |
| Stochastic Oscillator Strategy | Medium – interpreting oscillator signals | Low – uses stochastic indicator | Moderate – effective range-bound reversals | Range-bound markets | Early reversal signals, clear levels |
| News Trading Strategy | High – requires fast execution and event knowledge | High – real-time news and quick reactions | High – potential for significant profits | High-impact economic news events | Predictable timing, strong catalysts |
From Strategy to Execution: Your Next Steps to Trading Mastery
You have just explored a comprehensive arsenal of seven distinct and powerful trading strategies, from the precision of the Pin Bar to the momentum-driven Moving Average Crossover. We've detailed how to identify entry and exit points for each, whether you are reacting to price action, leveraging indicators like Bollinger Bands and RSI, or trading based on fundamental news events. Each pocket option strategy offers a unique lens through which to view the market, providing a structured framework for making informed trading decisions.
However, possessing a list of strategies is only the first step on the path to consistent profitability. The true differentiator between a novice and a master trader lies not in knowing more strategies, but in achieving deep proficiency with a select few. The most crucial takeaway from this guide is the principle of focused mastery combined with superior data analytics.
Turning Knowledge into Actionable Skill
Your immediate goal should not be to try all seven methods at once. Instead, your action plan is to transition from theoretical knowledge to practical, repeatable execution. This involves a deliberate and systematic process.
- Select Your Core Strategies: Review the Pin Bar, RSI Divergence, and Support and Resistance Bounce strategies. Do they resonate with your risk tolerance and personality? Perhaps the Stochastic Oscillator or News Trading better fits your style. Choose one or, at most, two strategies to begin with.
- Embrace the Demo Account: Before risking a single dollar, commit to practicing your chosen strategy on a Pocket Option demo account. This is your risk-free sandbox for testing entry rules, setting stop-losses, and understanding how the strategy performs under live market conditions.
- Integrate Professional-Grade Data: A strategy is only as reliable as the data it's based on. This is where leveraging OTC Charts MT4 becomes a non-negotiable advantage. By feeding real-time, accurate OTC quotes directly into your MT4 terminal, you can backtest and execute your chosen pocket option strategy with a level of precision that standard platform charts cannot offer. This is especially vital for weekend and after-hours trading.
- Maintain a Detailed Trading Journal: Document every trade. Note the strategy used, the entry and exit points, the rationale, and the outcome. This journal will become your most valuable resource for identifying patterns in your trading, refining your approach, and holding yourself accountable.
The Path Forward: From Trader to System Operator
By diligently following these steps, you elevate yourself from a speculative trader to a systematic operator. You are no longer guessing; you are executing a well-defined business plan based on a proven pocket option strategy and verified with high-fidelity data. This methodical approach builds discipline, manages emotion, and ultimately provides the foundation for long-term success in the dynamic world of binary options trading. Your journey to mastery starts now, with a single strategy, a commitment to practice, and the best tools at your disposal.
Ready to elevate your trading with professional-grade analytics? Integrate real-time, accurate data directly into your terminal with OTC Charts MT4 and start applying every pocket option strategy with the precision it deserves. Visit OTC Charts MT4 to gain your critical edge today.