

Are you trying to decipher market movements without the clutter of lagging indicators? Price action trading offers a direct, powerful approach by focusing on the raw movement of price itself. It’s a method that treats the chart as the ultimate source of truth, allowing traders to make decisions based on the "story" the price is telling in real-time. This guide is built to move you from theory to practical application, equipping you with a toolkit of the most effective price action trading strategies. We will dissect eight distinct methods, from foundational concepts like support and resistance to nuanced patterns like inside bars and engulfing candles.
Each strategy is presented with clear, actionable steps, making them accessible whether you're a beginner trader or an experienced analyst. You will learn not just what these patterns are, but how to identify them, when to act, and how to manage your risk. We'll provide specific examples and demonstrate how tools like OTC Charts on MT4 can enhance your precision, especially for after-hours or weekend trading. By the end of this article, you will have a comprehensive understanding of how to read the market's language and apply proven price action techniques to your own trading.
1. Support and Resistance Trading
Support and resistance trading is a foundational price action trading strategy. It involves identifying horizontal price levels on a chart where an asset's price has historically struggled to move past. Support is a price level where a downtrend can be expected to pause due to a concentration of demand, while resistance is where an uptrend can be expected to pause temporarily, due to a concentration of supply.

This strategy's power lies in its simplicity and reflection of market psychology. These levels represent a historical consensus of value, making them reliable reference points for future price behavior. Traders anticipate that price will respect these zones, creating high-probability entry and exit points.
How to Implement Support and Resistance Trading
The core idea is to buy near strong support levels and sell near strong resistance levels. For instance, if the EUR/USD pair repeatedly fails to fall below 1.1200, a trader might look to enter a long (buy) position the next time it approaches this level, anticipating a bounce. Conversely, if Bitcoin repeatedly tests the $65,000 mark and reverses, a trader could initiate a short (sell) position near that resistance.
Key Insight: The most potent support and resistance levels are those that have been tested multiple times without being broken. Each successful test reinforces the level's strength.
Actionable Tips for Success
To effectively use this strategy, especially with tools like OTC Charts MT4 which allow for clear level-drawing, consider these tips:
- Confirm with Candlesticks: Don't just trade because price touches a level. Wait for a confirmation signal, such as a bullish engulfing candle at support or a shooting star at resistance, to validate the potential reversal.
- Zone, Not a Line: Treat support and resistance as zones or areas, not as exact price lines. Price can often pierce a level slightly before reversing. This is where setting your stop-loss order just beyond the zone, not right on the line, becomes crucial.
- Volume Analysis: Use volume as a confirmation tool. Decreasing volume as price approaches a resistance level can indicate weakening buying pressure, increasing the likelihood of a reversal. Conversely, a spike in volume at a support level can signal strong buying interest.
2. Trend Line Trading
Trend line trading is a classic price action trading strategy that visualizes the direction and strength of a market trend. Instead of horizontal lines, this method uses diagonal lines to connect key swing points. An uptrend line is drawn by connecting successive higher lows, acting as dynamic support, while a downtrend line connects successive lower highs, serving as dynamic resistance.

Popularized by technical analysis pioneers like Richard Schabacker, this strategy helps traders identify high-probability entry points in the direction of the prevailing trend. When price approaches a well-established trend line, it often bounces, offering a chance to join the move. A decisive break of a trend line can signal a potential trend reversal or a shift in market momentum.
How to Implement Trend Line Trading
The primary approach is to trade in harmony with the trend. For example, if Apple stock is in a clear uptrend, a trader would draw an ascending trend line connecting the higher lows. They would then look for opportunities to buy when the price pulls back to touch this trend line, anticipating a bounce and continuation of the uptrend. Similarly, if GBP/JPY is consistently making lower highs, a trader could initiate a short (sell) position each time the price rallies up to the descending trend line.
Key Insight: A trend line's validity increases with the number of times it has been tested and held. A line connecting two points is tentative, but a third touch confirms it as a significant market structure.
Actionable Tips for Success
To master trend line trading, particularly with the drawing tools available in OTC Charts MT4, apply these specific techniques:
- Look for Confluence: Increase the probability of your trade by finding where a trend line intersects with other key levels, such as a horizontal support/resistance zone or a Fibonacci retracement level. This creates a powerful price action confluence.
- Don't Force the Fit: Only draw trend lines that connect obvious, significant swing points. If you have to adjust the line multiple times to make it touch the price, it likely isn't a valid trend line that the market is respecting.
- Use Multiple Timeframes: A major trend line on a daily chart holds more weight than a minor one on a 5-minute chart. Identify the primary trend on a higher timeframe and then use trend lines on a lower timeframe to find precise entry points in the direction of that larger trend.
3. Pin Bar Reversal Strategy
The Pin Bar Reversal is one of the most reliable single-candlestick price action trading strategies. It is characterized by a small real body and a long upper or lower wick (or tail) that extends significantly beyond the recent price range. The long tail represents a sharp rejection of prices at that level, signaling that the market's momentum may be about to shift in the opposite direction.

Popularized by traders like Nial Fuller, this pattern's strength comes from its clear visual representation of a battle between buyers and sellers where one side has decisively won. A bullish pin bar has a long lower tail, showing buyers aggressively rejected lower prices, while a bearish pin bar has a long upper tail, indicating sellers defended a higher price level. These are most powerful when they form at key support and resistance levels.
How to Implement the Pin Bar Reversal Strategy
The strategy involves identifying a valid pin bar at a logical point on the chart and trading in the direction of the rejection. For example, if a bullish pin bar with a long lower wick forms at a major support level on the EUR/USD chart, a trader might enter a long (buy) position. Similarly, if a stock forms a bearish pin bar at a key resistance level or a Fibonacci retracement point in a downtrend, it signals a high-probability short (sell) entry.
Key Insight: A pin bar is considered more potent when its long tail "probes" into empty space on the chart and clearly sticks out from the surrounding price action, demonstrating a definitive and powerful price rejection.
Actionable Tips for Success
To effectively trade pin bars, especially when spotting them with the clarity provided by OTC Charts MT4, apply these specific tips:
- Confluence is Key: Look for pin bars that form at a confluence of signals. A pin bar rejecting a horizontal resistance level that also lines up with a 50% Fibonacci retracement and a dynamic trend line is a much stronger signal than one appearing in isolation.
- Strategic Entry: Instead of entering the trade as soon as the pin bar closes, consider a more conservative entry. A common technique is to place a buy stop order just above the high of a bullish pin bar or a sell stop order just below the low of a bearish pin bar.
- Protect Your Capital: Place your stop-loss order just beyond the tip of the pin bar's long tail, adding a small buffer. This position represents the price level that was clearly rejected, and if the market trades beyond it, your trade idea is invalidated.
4. Breakout Trading
Breakout trading is a dynamic price action trading strategy focused on capitalizing on sudden, strong price movements. It involves entering a trade when the price moves decisively through a pre-defined level of significance, such as support, resistance, a trend line, or a chart pattern boundary. The core idea is that this "breakout" signals a shift in market sentiment and the beginning of a new trend in the direction of the break.
This strategy is popular because it targets moments of momentum, often leading to rapid gains. Unlike reversal strategies, breakout trading aligns with the prevailing force entering the market. Successful breakouts are typically accompanied by a surge in volume, confirming the conviction behind the move and suggesting that the price has the fuel to continue its trajectory.
How to Implement Breakout Trading
The strategy is straightforward: buy when price breaks above a key resistance level or sell when it breaks below a key support level. For example, if Tesla stock has been consolidating below a $200 resistance level for weeks, a trader would place a buy order once the price closes firmly above $200, anticipating further upward movement. Similarly, a breakout below a long-term trend line in the USD/JPY pair would signal a potential short-selling opportunity.
Key Insight: The most powerful breakouts often occur after prolonged periods of consolidation or range-bound trading. The longer the price is contained, the more explosive the eventual move tends to be.
Actionable Tips for Success
To effectively trade breakouts, especially when analyzing historical price data to validate levels on platforms like OTC Charts MT4, consider these tactics:
- Confirm with a Strong Close: Don't enter a trade on a mere price spike through a level. Wait for a candle to close decisively beyond the breakout point. This helps filter out "fakeouts," where price temporarily pierces a level only to reverse.
- Volume Expansion is Key: A true breakout should be accompanied by a significant increase in trading volume. High volume indicates strong participation and conviction from institutional traders, making the move more likely to sustain itself.
- Plan for Pullbacks: A common price action pattern is a breakout followed by a pullback to retest the broken level. A patient approach is to wait for this retest to enter, which often provides a better risk-to-reward ratio. You can learn more about how to validate these patterns on otc-charts-mt4.com.
- Set Stops Strategically: Place your initial stop-loss order back inside the broken structure. For a bullish breakout, the stop would go just below the former resistance level. This gives the trade room to breathe while defining your risk clearly.
5. Inside Bar Strategy
The Inside Bar is a powerful two-bar price action pattern that signals a period of market consolidation or indecision. It forms when the entire range of the current candle, both its high and low, is contained within the range of the immediately preceding candle, often called the "mother bar." This pattern is a favorite among price action trading strategies because it often precedes a significant breakout.
This strategy's value lies in its ability to pinpoint moments of equilibrium before a new directional move. The market is essentially coiling up, building energy for its next leg. Traders use the break of the inside bar's range as a trigger to enter a trade, capitalizing on the resulting expansion in volatility.
How to Implement the Inside Bar Strategy
The core concept is to trade the breakout from the inside bar's range. For example, if an inside bar forms along a daily uptrend line on the GBP/JPY chart, a trader would place a buy-stop order just above the inside bar's high. If triggered, the trade enters in the direction of the established trend. Conversely, if an inside bar appears near a strong resistance level after a prolonged rally, a sell-stop order below its low could capture a potential reversal.
Key Insight: The most powerful inside bar setups occur in the context of a strong, pre-existing trend. They act as continuation signals, offering a low-risk entry point to rejoin the dominant market momentum.
Actionable Tips for Success
To master this strategy using precise charting tools like OTC Charts MT4, which clearly display candlestick patterns, focus on these tips:
- Context is King: The location of the inside bar is paramount. Look for them at key support and resistance levels, trend lines, or moving averages. An inside bar in the middle of a choppy range is far less reliable than one forming at a significant technical confluence.
- Timeframe Matters: Use larger timeframes like the daily or 4-hour chart to identify the overall trend and key levels. You can then drop to a lower timeframe to spot inside bar patterns for more precise entries, but always in alignment with the higher timeframe's context.
- Multiple Inside Bars: When you see two, three, or even more inside bars forming consecutively within the same mother bar, it signals extreme consolidation. This "coiling spring" effect often leads to a much more explosive and reliable breakout when it finally occurs.
6. Engulfing Pattern Strategy
The engulfing pattern is a powerful two-candlestick reversal signal and a cornerstone of many price action trading strategies. This pattern forms when the body of the second candle completely "engulfs" the body of the preceding candle, signaling a potential and often aggressive shift in market control. A bullish engulfing pattern appears at the end of a downtrend, while a bearish engulfing pattern materializes at the end of an uptrend.
This strategy is effective because it provides a clear visual representation of a momentum reversal. When a large bullish candle engulfs a smaller bearish one, it indicates that buyers have overwhelmed sellers. The opposite is true for a bearish engulfing pattern, making it a reliable indicator for traders anticipating a trend change.
How to Implement the Engulfing Pattern Strategy
The core approach is to identify an engulfing pattern at a key price level and trade in the direction of the engulfing candle. For instance, if a stock in a downtrend forms a bullish engulfing pattern at a major support level, a trader might enter a long (buy) position. Similarly, if a currency pair like GBP/USD forms a bearish engulfing pattern at a Fibonacci retracement level after a strong rally, it could signal a high-probability short (sell) entry.
Key Insight: The significance of an engulfing pattern increases dramatically when it forms at a confluent area, such as a support/resistance zone, a trendline, or a key moving average.
Actionable Tips for Success
To master this strategy using precise charting tools, such as those available on the OTC Charts MT4 platform, consider the following tips. If you want a deeper dive, you can learn more about understanding candlestick charts.
- Confirm with Context: Never trade an engulfing pattern in isolation. Ensure it aligns with the broader market context. A bullish engulfing pattern is much more reliable in an overall uptrend (as a pullback signal) than in a strong, established downtrend.
- Size Matters: The larger the engulfing candle is in relation to the prior candle and surrounding price action, the more significant the signal. A massive engulfing candle indicates a more decisive and powerful shift in sentiment.
- Wait for Confirmation: For a more conservative approach, wait for the next candle to close in the direction of the engulfing pattern before entering a trade. This "follow-through" confirms the momentum shift and helps avoid false signals. Your stop-loss can be placed just beyond the high (for bearish) or low (for bullish) of the engulfing candle.
7. Price Action Scalping
Price action scalping is a high-frequency trading strategy that capitalizes on very small price movements. Scalpers operate on extremely short timeframes, typically between one and five minutes, aiming to accumulate numerous small profits that add up over the course of a trading session. This approach relies on identifying fleeting patterns like momentum shifts, tiny pullbacks, and order flow imbalances that are only visible on lower charts.
This strategy demands intense focus, rapid decision-making, and an unwavering commitment to risk management. Unlike longer-term strategies, scalping is a game of speed and precision, where success is measured in pips or ticks rather than large percentage gains on a single trade. It is one of the most demanding price action trading strategies due to its high-paced nature.
How to Implement Price Action Scalping
The core objective is to enter and exit the market within minutes, sometimes even seconds. For example, a scalper watching the EUR/USD pair on a 1-minute chart during the volatile London session open might notice a momentary surge in buying pressure. They would enter a long position to capture a quick 5-10 pip gain before the initial momentum fades, exiting as soon as the first sign of a stall appears. Similarly, a crypto scalper might trade Bitcoin during a high-impact news release, profiting from the immediate volatility.
Key Insight: Successful scalping isn't about predicting the market's long-term direction; it's about exploiting temporary supply and demand imbalances for immediate, consistent gains.
Actionable Tips for Success
To master scalping, particularly with fast-updating tools like OTC Charts MT4 that provide real-time data, discipline is paramount. Consider these essential tips:
- Focus on Liquid Markets: Stick to assets with high liquidity and tight spreads, like major forex pairs (e.g., EUR/USD) or highly traded futures (e.g., ES). This minimizes transaction costs, which can quickly erode small profits.
- Establish Ironclad Rules: Define your exact entry and exit criteria before entering a trade and stick to them without hesitation. For scalping, a strict stop-loss and a pre-determined profit target are non-negotiable.
- Start with Small Position Sizes: The high-frequency nature of scalping can lead to rapid losses if you are overleveraged. Begin with a minimal position size to develop your skills and confidence before scaling up.
- Analyze Your Performance: Keep a detailed trading journal. Track metrics like win rate, average profit/loss, and trade duration to identify what's working and refine your strategy.
8. Market Structure Trading
Market structure trading is a comprehensive price action trading strategy that focuses on the bigger picture of price movement. It involves analyzing the sequence of highs and lows to determine the overall market trend, identifying it as an uptrend (higher highs and higher lows) or a downtrend (lower highs and lower lows). This method provides a clear framework for understanding market direction and anticipating potential trend changes.
This infographic illustrates the core components of market structure analysis, showing how swing patterns, structural breaks, and market phases are interconnected.
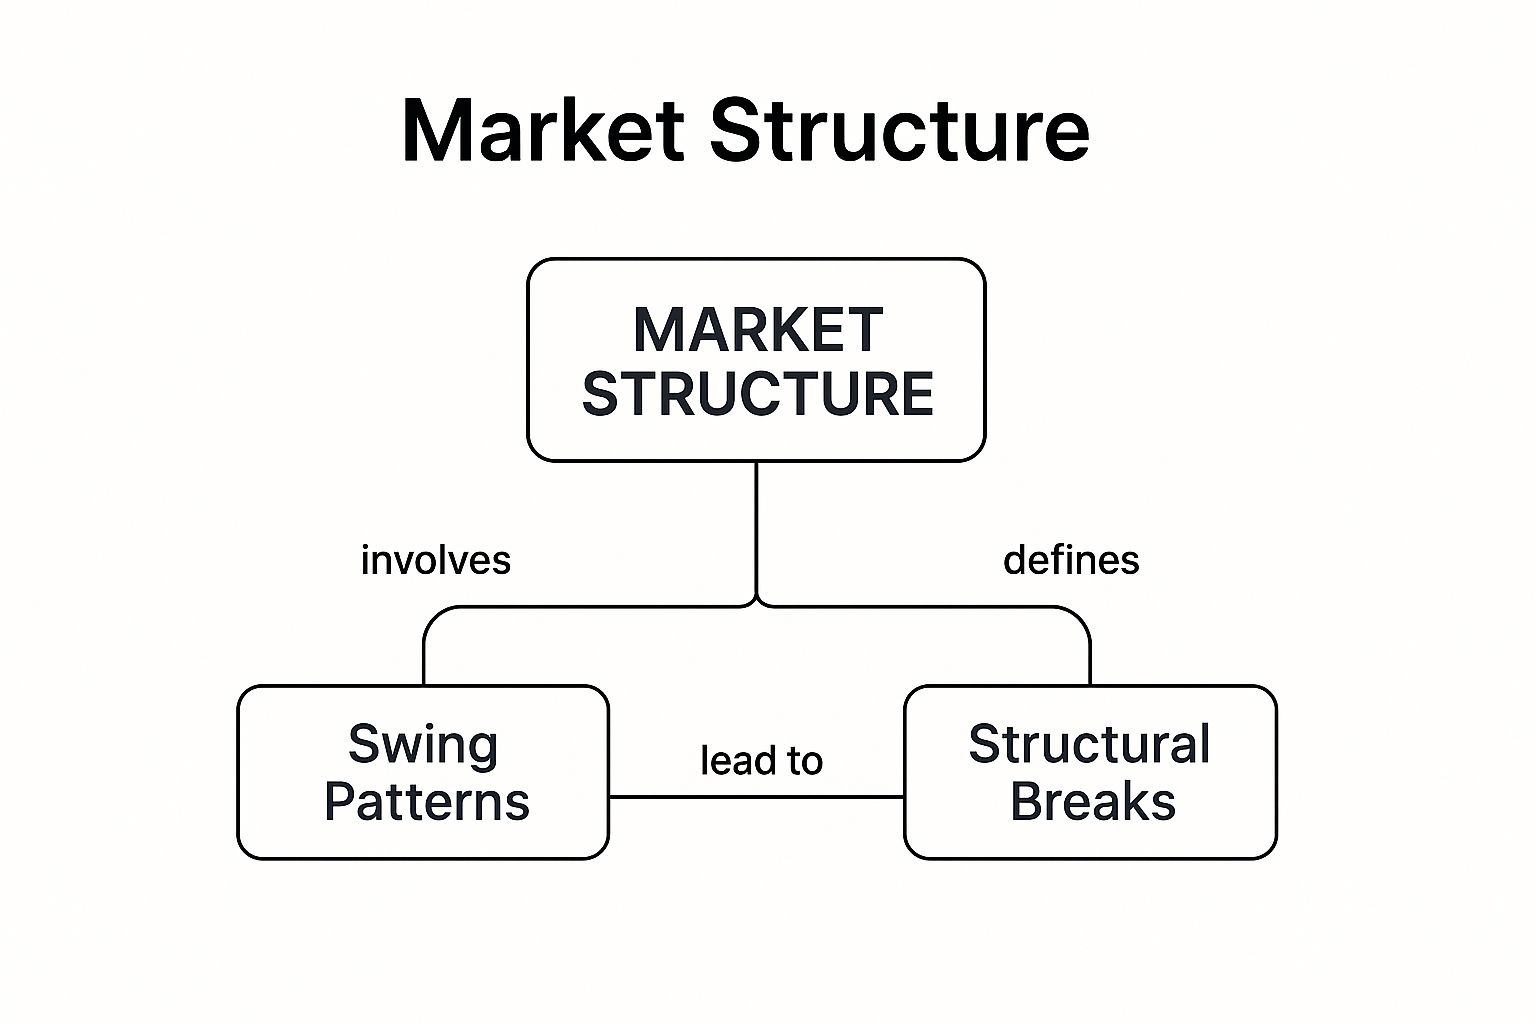
By visualizing these relationships, traders can see how a change in swing patterns leads to a structural break, which in turn signals a shift in the market phase from trending to ranging or vice versa.
The strategy's value comes from its ability to align traders with the dominant market flow. By identifying "breaks of structure" (a failure to create a new higher high in an uptrend, for example), traders can spot early signs of a trend reversal or exhaustion, offering opportunities to enter new trends before they are widely recognized.
How to Implement Market Structure Trading
The primary goal is to trade in the direction of the established structure and anticipate changes. For instance, in a clear uptrend on the GBP/JPY chart, a trader would look for price to pull back and form a new higher low. This pullback area, often a previous resistance that is now acting as support, becomes a high-probability zone to enter a long (buy) position. A break of this higher low pattern would signal a potential trend change.
Key Insight: The most significant trading opportunities arise at a "break of structure" (BoS) or a "change of character" (CHoCH), where the market fails to continue its existing pattern of highs and lows.
Actionable Tips for Success
To master market structure, particularly when using platforms like OTC Charts MT4 to map out price swings, consider these tips:
- Start with Higher Timeframes: Analyze the daily or 4-hour chart to identify the major market structure. This top-down analysis prevents you from trading against the dominant, long-term trend.
- Focus on Obvious Levels: Trade based on clear, obvious swing highs and lows that are easily visible to most market participants. These are the levels that are most likely to be defended or broken with conviction.
- Combine with Volume: A structural break accompanied by a surge in volume is a much stronger signal than one with low volume. High volume confirms participation and intent behind the move. Understanding these dynamics is crucial, and it pairs well with robust risk management techniques.
Price Action Strategies Comparison Table
| Strategy | Implementation Complexity 🔄 | Resource Requirements ⚡ | Expected Outcomes 📊 | Ideal Use Cases 💡 | Key Advantages ⭐ |
|---|---|---|---|---|---|
| Support and Resistance Trading | Low to Medium (Beginner to Intermediate) | Low | High probability setups in ranging markets | All markets, all timeframes, especially ranges | Simple identification, clear entry/exit, risk management |
| Trend Line Trading | Low to Medium (Beginner to Intermediate) | Low | Effective trend direction & reversal signals | Trending markets, medium to long-term | Visual trend clarity, early reversal identification |
| Pin Bar Reversal Strategy | Medium (Intermediate) | Low | High probability reversal signals at key levels | Short to medium-term reversal trades | Single candle setup, clear risk-reward, all timeframes |
| Breakout Trading | Medium to High (Intermediate to Advanced) | Medium | Capture large moves early with momentum | Volatile markets, trending & range-bound | Early moves, clear entries, suited for automated systems |
| Inside Bar Strategy | Medium (Intermediate) | Low | Breakout opportunities from consolidation | Trending markets, short to medium-term | Tight stops, good risk-reward, continuation/reversal |
| Engulfing Pattern Strategy | Low to Medium (Beginner to Intermediate) | Low | Strong reversal signals | All markets, short to medium-term | Clear signals, easy identification, good risk management |
| Price Action Scalping | High (Advanced) | High (capital, focus, tech) | Consistent small profits, quick feedback | Very short-term, active trading, high-volume markets | Frequent opportunities, limited overnight risk |
| Market Structure Trading | High (Advanced) | Medium to High | Comprehensive market understanding and timing | All markets & timeframes, position trading | Holistic approach, high-probability trades, risk management |
Building Your Personal Price action Trading Plan
We have journeyed through some of the most effective and widely used price action trading strategies, from the foundational principles of support and resistance to the dynamic patterns of inside bars and engulfing candles. Each strategy offers a unique lens through which to interpret the market's narrative, a story told purely through the movement of price on your chart. You've seen how identifying market structure, trading breakouts, and scalping with precision are not just abstract theories but actionable techniques you can begin to implement.
The true power, however, lies not in knowing these strategies in isolation, but in synthesizing them into a coherent and personalized trading plan. No single strategy is a silver bullet; the market is far too complex and dynamic for a one-size-fits-all approach. Your task now is to become a craftsman, carefully selecting the tools that best fit the market conditions you observe and, most importantly, your own trading psychology and risk tolerance.
From Knowledge to Actionable Strategy
Mastering these concepts requires moving beyond rote memorization. It's about developing an intuitive feel for the market's rhythm. The key takeaway is that all these price action trading strategies are interconnected. A breakout from a range is often preceded by an inside bar consolidation near a key support or resistance level. A pin bar might signal a reversal precisely at a long-term trend line.
Your next steps should be methodical and deliberate:
- Focus and Specialize: Instead of trying to master all eight strategies at once, choose one or two that resonate with you. Perhaps you have a keen eye for reversals (Pin Bar, Engulfing Pattern) or maybe you prefer the momentum of breakouts.
- Backtest Rigorously: Use historical data to test your chosen strategy. This is where you will build confidence and identify the specific market conditions where your strategy excels or falters.
- Demo Trade with Purpose: Move to a demo account and apply your strategy in a live, risk-free environment. Your goal here is not to make fantasy profits but to practice execution, manage your emotions, and refine your entry and exit criteria.
- Create Your Rulebook: Document everything. What constitutes a valid setup? What is your exact entry trigger? Where will you place your stop-loss and take-profit? A written plan removes guesswork and emotion when real capital is on the line.
Embracing the Art of Reading Charts
Ultimately, becoming a proficient price action trader is about learning to read the story the market is telling you, moment by moment. It's a skill built on a foundation of screen time, disciplined practice, and relentless review. By understanding the psychology behind the patterns-the fear, greed, and indecision that create candlesticks-you transform from a passive observer into an active participant in the market's flow.
The journey to consistently profitable trading is a marathon, not a sprint. The price action trading strategies detailed in this guide are your building blocks. Now, go build your fortress of skill, one disciplined trade at a time. The market is waiting to be read, and you now have the language to understand it.
Ready to apply these powerful strategies with professional-grade tools, even on weekends? OTC Charts MT4 provides real-time, 24/7 OTC market data directly within your MT4 platform, allowing you to backtest and trade price action setups whenever you want. Elevate your analysis and never miss an opportunity by visiting OTC Charts MT4 to get started.