
A simple trading system is your personal set of rules—the playbook that tells you exactly when to enter, exit, and manage every single trade. The whole point is to take emotion and guesswork out of the equation, giving you a disciplined, repeatable framework for engaging with the markets. It’s not about finding a "holy grail" strategy; it's about finding a solid one that you can actually stick to.
Why a Simple Trading System Is Your Greatest Asset
Let's be real for a moment. Trading can feel overwhelmingly complex, with its dizzying array of charts, indicators, and so-called expert advice. A lot of new traders fall into the trap of thinking that a more complicated setup must be a better one. In my experience, the opposite is almost always true. Overcomplicating things just leads to "analysis paralysis," leaving you frozen and second-guessing yourself when you need to act.
The real strength of a simple trading system is its clarity. When you focus on a handful of core rules that you know inside and out, you build a process you can repeat day in and day out. This is how you shift trading from a high-stress guessing game into a methodical, business-like operation. The aim isn't to be basic; it's to be ruthlessly efficient and decisive.
Your trading system is your personal rulebook. Think of it as the buffer between your emotions and your trading capital, making sure every decision is driven by logic and probability—not fear or greed.
Shifting From Gut Feelings to Data-Driven Decisions
One of the biggest pitfalls I see traders tumble into is making decisions based on a gut feeling or getting swept up in market hype. While intuition can develop over time, it’s a shaky foundation for long-term, profitable trading. A structured system forces you to lean on pre-defined, objective criteria. This not only hammers in discipline but also gives you a clear path for improvement. If your system hits a rough patch, you can actually analyze its components and make logical tweaks instead of just guessing what went wrong.
This isn’t just my opinion; it’s backed by statistical reality. Research into futures markets has repeatedly shown that simple, rule-based systems can deliver a real edge when they're tested against historical data. Markets are inherently volatile, making random guesses a recipe for disaster. By backtesting specific patterns, traders can uncover strategies with success rates often between 55% and 65%. That statistical backing is what builds true confidence and lets you manage risk effectively. You can read more about how statistical analysis is applied to trading patterns to go deeper on this.
A great system lets you compare a systematic approach against a purely discretionary one. Here's a quick breakdown:
Systematic Trading vs Discretionary Trading at a Glance
| Attribute | Simple Trading System | Discretionary Trading |
|---|---|---|
| Decision-Making | Based on pre-defined rules and objective signals | Based on intuition, experience, and subjective analysis |
| Emotional Impact | Minimized; decisions are mechanical | High; susceptible to fear, greed, and bias |
| Consistency | High; actions are repeatable and predictable | Low; varies based on trader's mood and market feel |
| Scalability | Easy to backtest, optimize, and automate | Difficult to scale or replicate consistently |
| Review Process | Performance is easily measured and analyzed | Hard to identify specific reasons for wins or losses |
Ultimately, a simple system provides a robust framework that discretionary trading often lacks, paving the way for more consistent results.
The Clear Advantage of Simplicity
A simple system helps you zero in on high-probability setups that you can spot and act on without hesitation—even when the pressure is on. At the end of the day, the most successful trading systems are the ones you can follow flawlessly.
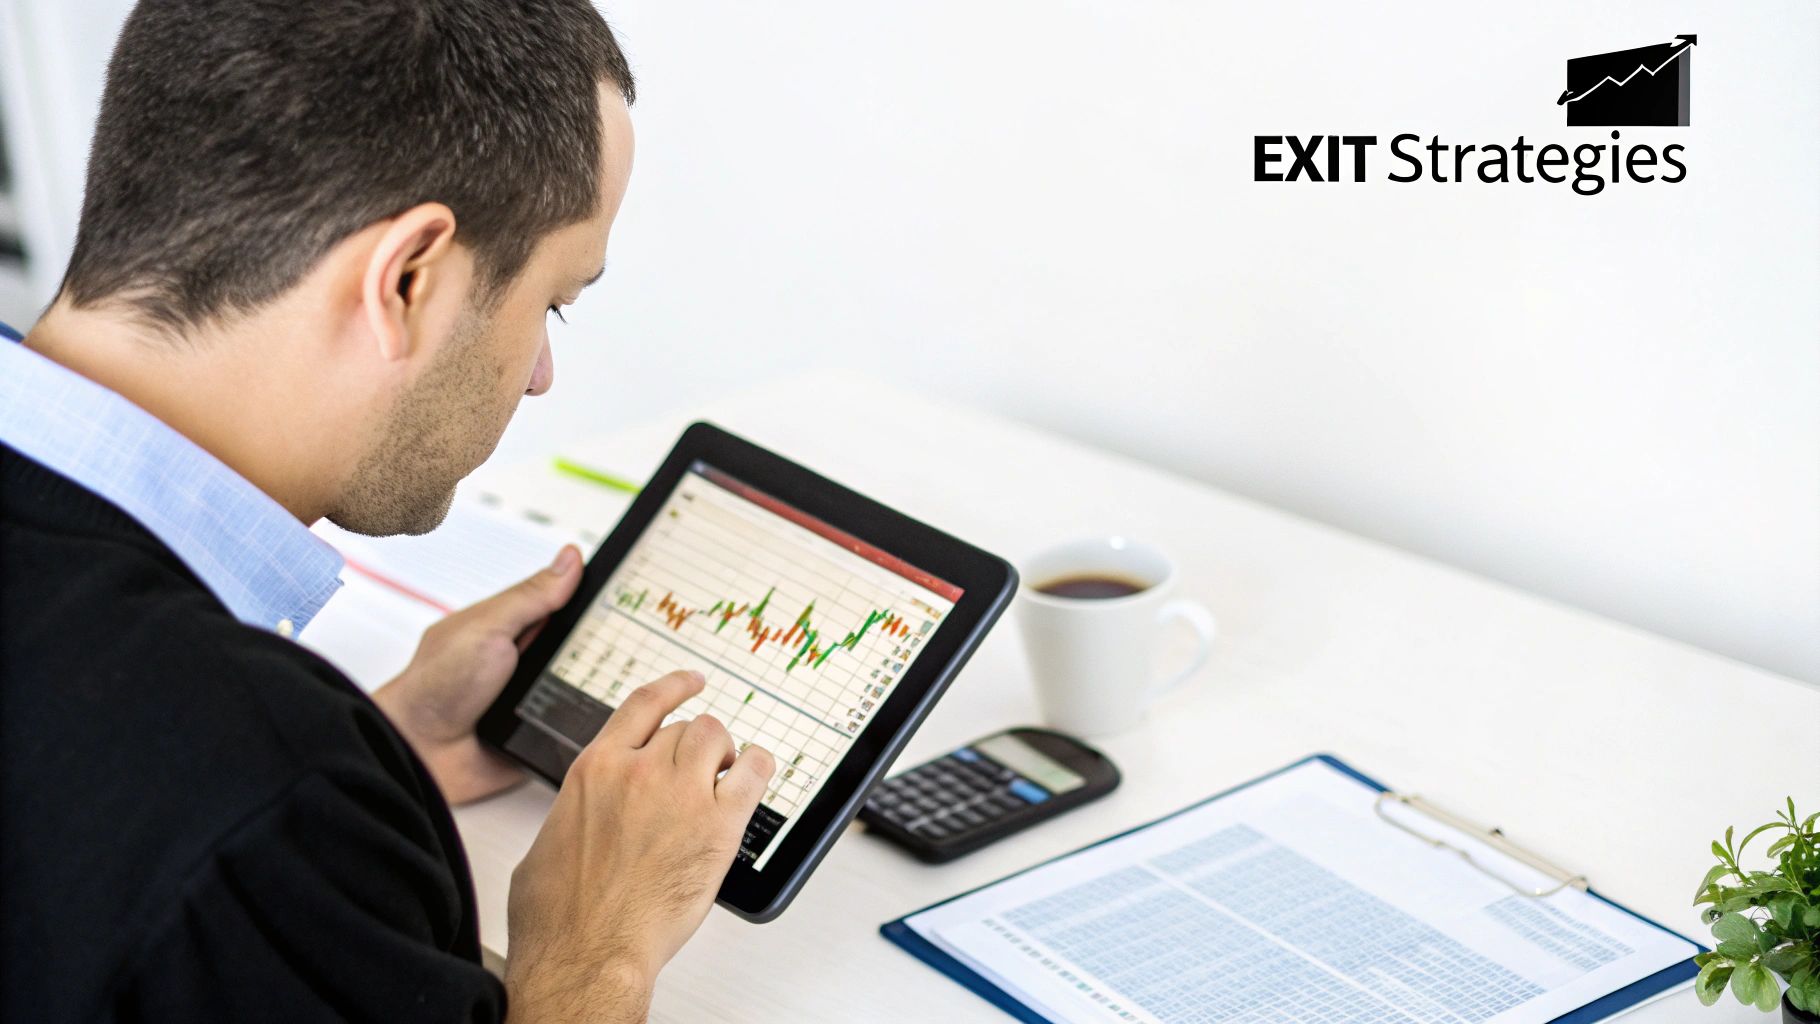
This image shows the kind of performance metrics you can expect from a well-defined, simple trading system, including win rate, average profit, and maximum drawdown.
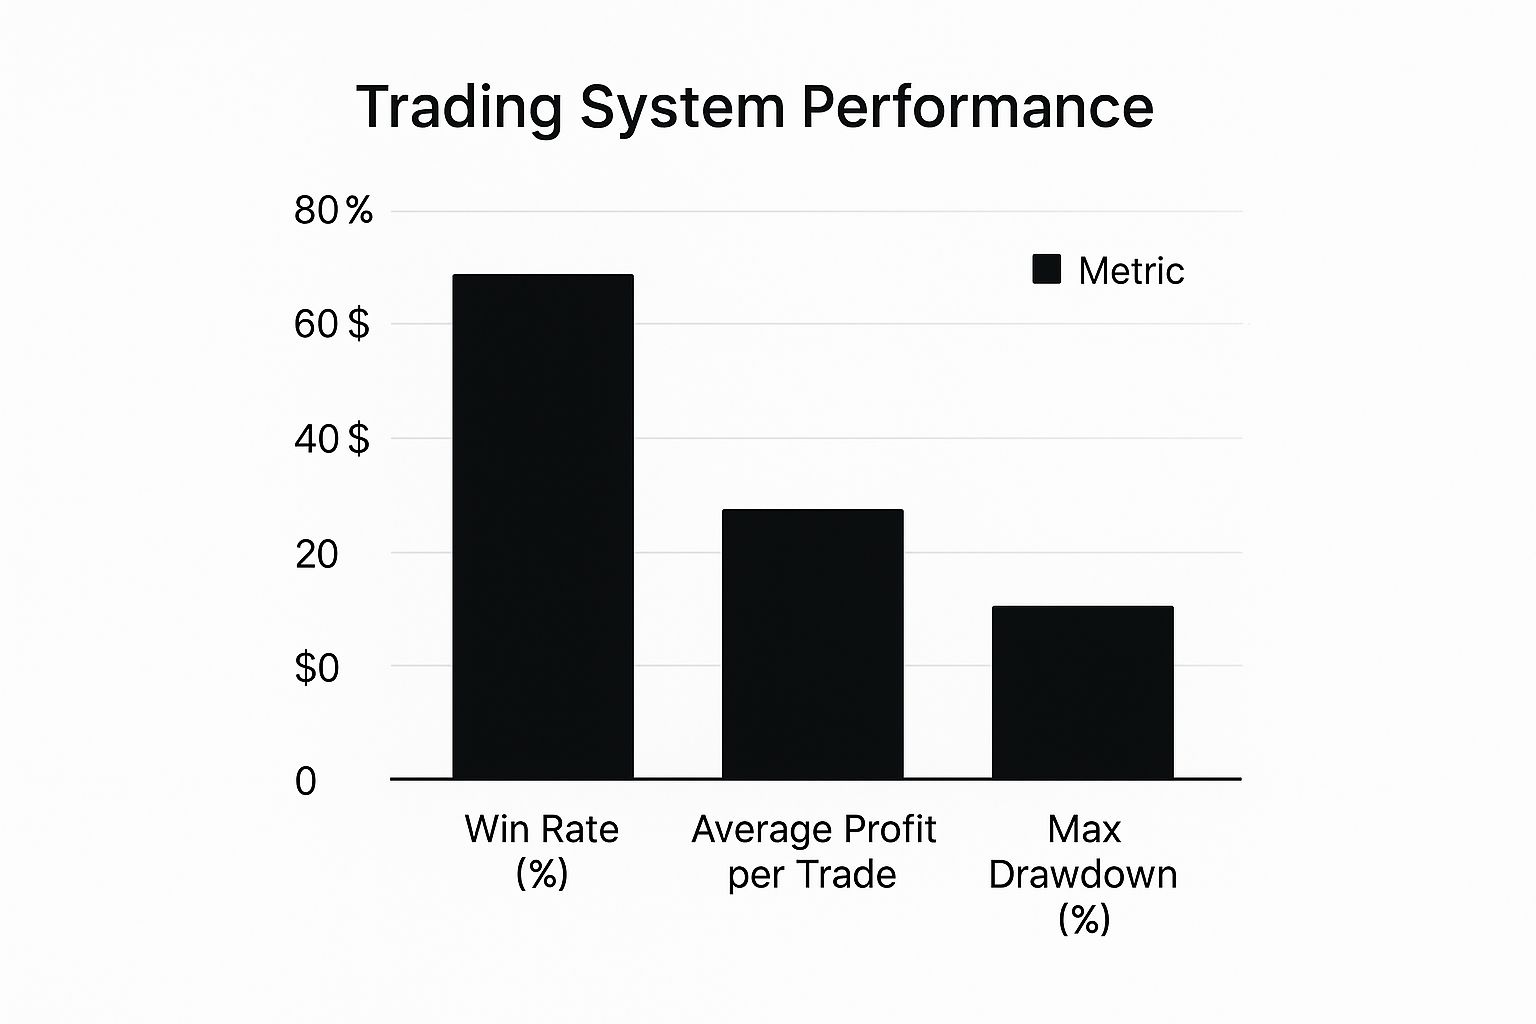
What this data really shows is how a positive win rate, when paired with tightly controlled drawdowns, can create a sustainable growth curve over time. It’s never been about winning every trade. It's about making sure your winners count and your losers are kept small and manageable.
Laying the Foundation with Core Components
Before you even think about indicators or drawing lines on a chart, let's talk about what actually holds a trading system together. Every solid strategy I've ever seen or used rests on three core pillars.
Get these right, and you've built a sturdy frame for your trading. Get them wrong, and it doesn't matter how brilliant your entry signals are—the whole thing will eventually fall apart. This is where you stop gambling and start building a real process.
Pillar 1: Your Market and Timeframe
First things first: what are you going to trade, and on what chart? This one decision changes everything. It dictates the kind of opportunities you'll see, the pace of your trading, and frankly, the mental stress you'll endure. So many aspiring traders fail right here because they bounce around from currency pairs to stocks to crypto, never truly learning the rhythm of any single market.
I've seen countless traders try to scalp a volatile instrument on a one-minute chart. It looks like a fast path to profits, but it’s usually just a firehose of market noise that invites emotional decisions and burnout.
Let's consider a saner alternative. What if you focused on one thing, like the SPY (the big ETF that tracks the S&P 500), and only looked at the daily chart? Instantly, you've cut out all the intraday chaos. You make one decision per day, after the market closes, with a clear head. This is the bedrock of a truly simple trading system.
Pillar 2: Clear Entry and Exit Triggers
Okay, you've picked your battleground. Now, you need crystal-clear rules that scream "GET IN" or "GET OUT." The key here is unambiguous. Your entry signal needs to be so obvious that if ten traders looked at your chart, all ten would point to the exact same candle.
This is where people get lost in the weeds, stacking five different indicators hoping to find a "perfect" signal that doesn't exist. Simpler is almost always better and more durable. Take a classic moving average crossover, for example. There’s a reason it's been a staple of simple trading systems for decades.
A rule like, "I will go long when the 50-day moving average crosses above the 200-day moving average," is completely mechanical. It's binary. It either happened, or it didn't. There's no room for "gut feel" or second-guessing.
This mechanical nature is your best friend. It enforces discipline and, just as importantly, makes your system something you can actually backtest and validate. Your exit rules need to be just as rigid, defining exactly where you’ll take profit and, more critically, where you’ll admit you were wrong and cut the loss.
Pillar 3: An Unbreakable Risk Management Plan
This is it. The most important pillar of them all. You can have the best entry signals known to man, but without an ironclad plan for managing risk, you are guaranteed to blow up your account. I'm not being dramatic; it's a mathematical certainty. Risk management is the one thing that keeps you in the game long enough to win.
Before you even think about clicking the buy button, your plan must answer two questions:
- How much am I willing to lose on this idea? The standard professional rule is to risk no more than 1% of your total account equity on a single trade.
- How do I make that happen? This isn't just about placing a stop-loss. It's about calculating your position size based on that 1% risk and the distance to your stop.
Risk shouldn't be an afterthought; it should be the very first calculation you make. It ensures that one bad trade—or even five bad trades in a row—is just a small, manageable cost of doing business, not a catastrophic event.
Crafting Your Entry and Exit Rules with Precision
Alright, this is where the rubber meets the road. We're going to systematically eliminate guesswork from your trading. A system’s rules are its engine, turning all that market noise into clear, non-negotiable actions. If a rule is ambiguous or leaves you wondering, "Does this count?"—it's not a rule. It's just a suggestion, and suggestions don't build discipline.
The goal here is to create a process so mechanical you could write it on a sticky note and follow it without a second thought. This is how you take emotion out of the equation and ensure every trade you place is based on a pre-defined edge, not just a gut feeling.
Building Your Entry Logic
Your entry trigger is the specific set of conditions that must happen before you risk a single dollar. One of the most classic and effective ways to build a simple trading system is to pair a trend-following indicator with a momentum oscillator. It’s a powerful combination: one tells you the market's main direction, and the other helps you pick a good moment to jump in.
Let's walk through a practical example for going long. We'll use two of the most common indicators out there: a moving average to gauge the trend and the Relative Strength Index (RSI) to time our entry.
- The Trend Filter: We'll use the 50-period moving average (MA) as our line in the sand. If the price is trading above the 50 MA, we’re only interested in buying. If it's below, we either sit on our hands or look for short setups (if that's part of our system).
- The Entry Trigger: For timing, we'll watch the 14-period RSI. The classic signal we're looking for is a dip into oversold territory (below 30). But we don't buy just because it's oversold; we wait for it to cross back above the 30 level. This is our cue that momentum is potentially shifting back in the direction of our main trend.
So, when you put it all together, you get a completely unambiguous entry rule.
Go Long ONLY IF:
- The price is currently trading above the 50-period moving average.
- The 14-period RSI has just crossed above the 30 level from below.
Both conditions have to be true. Not one or the other. This mechanical clarity is the bedrock of a solid trading system.
Defining Your Exit Strategy
Knowing when to get out is just as important—if not more so—than knowing when to get in. This applies to both taking profits and, crucially, cutting your losses. A trading plan without predefined exits is like a ship without a rudder; you’re just along for the ride.
A complete exit strategy always has two parts:
- Profit Target: Where are you cashing in? You could use a fixed risk-to-reward ratio (like aiming to make twice what you've risked) or target a technical level, such as a clear area of resistance on the chart.
- Stop-Loss: This is where you admit the trade isn't working and get out. Your stop-loss is your escape hatch, the single most important rule for protecting your capital. A common-sense spot for a long trade is just below a recent swing low.
Continuing with our example, a set of exit rules might look like this:
Take Profit: Sell the position when the price hits the nearest major resistance level you identified before you even entered the trade.
Stop-Loss: Place your initial stop-loss just a few pips below the low of the candle that gave you the entry signal.
This complete framework—market, timeframe, entry, and exits—creates a cohesive and simple trading system you can test and execute with real confidence.
Don't underestimate the power of simplicity. Even a system based on a single, well-defined pattern can be surprisingly robust. For instance, a backtest on the S&P 500 ETF (SPY) showed that buying after a bearish engulfing candle and holding for just one day produced a win rate of around 62% since 2017. This is a great example of how a simple, statistically sound trigger can hold its own. If you want to dive deeper, you can learn more about how backtesting validates simple trading strategies on buildalpha.com.
Mastering Risk Management to Ensure Longevity
Let's get one thing straight. You can have the most brilliant entry signals in the world, but without disciplined risk management, you're not trading—you're gambling. Risk management isn't just another part of your trading system; it's the very foundation that keeps a few bad trades from wiping you out.
Forget the vague advice you've heard before. Real risk control is a precise, mathematical process that you complete before you ever click the buy button. It's all about defining exactly how much you're willing to lose and then structuring your entire trade around that number.
The 1% Rule in Action
A cornerstone for any serious trader is the 1% rule. The principle is simple: never risk more than 1% of your total trading capital on a single idea. It sounds basic, but its real power is in protecting your account through the losing streaks that every single trader faces.
Let's say you're working with a $10,000 account. Applying the 1% rule means your maximum acceptable loss for your next trade is $100. Period. That number becomes the anchor for every other decision you make on that trade.
By pre-defining your maximum loss, you turn a potentially catastrophic event into a manageable business expense. This shift in mindset is crucial for long-term survival and is a core part of any successful, simple trading system.
From Risk Amount to Position Size
So, you know you can only lose $100. How do you actually make sure that happens? This is where position sizing comes into play. You have to calculate the exact number of shares or contracts to trade based on the distance between your entry and your stop-loss.
Let's walk through a real-world scenario:
- Your Account: $10,000
- Max Risk (1%): $100
- Entry Price: You've identified a stock you want to buy at $50.00.
- Stop-Loss Price: Your analysis tells you to place your stop-loss at $48.00.
First, you need to figure out the risk per share. That’s just the difference between your entry and your stop: $50.00 – $48.00 = $2.00.
Now, you can determine your position size by dividing your max risk by that per-share risk: $100 / $2.00 = 50 shares. That's it. That is the exact number of shares you can buy to stick to your 1% rule. If the trade goes against you and hits your stop, your loss is capped right where you planned. If you want to get more advanced, you can explore various trading risk management techniques that build on this fundamental concept.
Prioritizing Favorable Risk-to-Reward Ratios
The final piece of the puzzle is the risk-to-reward ratio. It’s not enough to just control your losses; your potential profits need to make the risk worthwhile. A common professional benchmark is aiming for a minimum 1:2 risk-to-reward ratio.
This means that for every $1 you're willing to risk, you should be aiming to make at least $2 in profit. In our example, you're risking $2.00 per share. To meet a 1:2 ratio, your profit target should be at least $4.00 per share above your entry, placing it at $54.00 or higher. This setup ensures that even if you only win on a fraction of your trades, you can still come out profitable over time.
See If Your System Actually Works: Backtesting and Performance Metrics
Would you jump out of a plane without checking your parachute first? I didn't think so. In the same way, you should never trade a new system with real money until you've seen how it holds up against the past.
This is where backtesting comes in. It’s the single most important step in turning a good idea into a trading strategy you can truly rely on. This is where the rubber meets the road.
The idea is simple enough: you pull up historical charts and apply your entry, exit, and risk management rules, trade by trade, as if it were happening live. This isn't about cherry-picking the "obvious" winners. It’s a disciplined, manual simulation. You have to take every single signal your system generates, good or bad. This process gives you hard data on how your simple trading system would have fared in the wild.
The point isn't just to see if you would have made money. It’s to get to know your system’s personality—its quirks, its strengths, and its breaking points. This is what separates traders who have a real edge from those who are just guessing. We cover the nuts and bolts of this in our complete guide on how to backtest trading strategies.
Digging into the Numbers That Matter
After you've run your backtest, you'll be left with a log of simulated trades. Now it's time to crunch the numbers using key performance metrics. These stats cut right through your emotions and tell you the unbiased truth about your system’s viability.
There are a few metrics that are absolutely essential for evaluating any simple trading system. The quality of a strategy isn’t just about the final profit; it’s about how it got there. You'll want to look at the equity curve, win ratio, and Sharpe Ratio, but two of the most revealing are Maximum Drawdown and Profit Factor. For example, a healthy Profit Factor should be well above 1.5, showing your winners are strong enough to carry the losses. You can get a deeper look into all the critical trading performance metrics over at QuantifiedStrategies.com.
What Maximum Drawdown and Profit Factor Really Tell You
Let’s zero in on why these two metrics are so crucial for any trader.
-
Maximum Drawdown (MDD): If you only look at one metric, make it this one. It shows you the largest single drop your account took from a high point to a low point during the test. Think of it as a pain-o-meter. It answers the question: "What's the worst losing streak I can expect?" A system with a 15% MDD is a lot easier to stick with psychologically than one with a 50% MDD, even if they produce the same overall profit.
-
Profit Factor: This is a fantastic, at-a-glance measure of your system's efficiency. You simply divide your total profits from winning trades by your total losses from losing trades. A Profit Factor of 2.0 is excellent—it means your system made $2 for every $1 it lost. If it's below 1.0, you've got a losing system. To be safe, I always look for a Profit Factor comfortably above 1.5 before even considering a strategy robust.
Focusing on objective data like this is how you move from "hoping" a system works to "knowing" it has a statistical edge. That knowledge is what gives you the confidence to pull the trigger without hesitation when your money is on the line.
Common Questions About Building Your Trading System
Even with a solid plan, a few questions always pop up when you're putting your first trading system together. That’s completely normal. Getting stuck on these little details is just part of the journey.
Let's walk through some of the most common hurdles I see traders face and give you some straightforward, practical answers to get you over them.
How Do I Pick the Right Indicators?
Honestly, the "best" indicators are the ones you actually understand inside and out. The point isn't to find some obscure, complex tool that promises the world. You need something that gives you crystal-clear signals that directly map to your entry and exit rules. No ambiguity.
If you're just starting out, keep it simple. I always recommend new traders begin with a classic combination:
- A Moving Average: Great for getting a quick read on the overall trend direction.
- The Relative Strength Index (RSI): Perfect for timing your entries by identifying overbought or oversold conditions.
Focus on really mastering these two before you even think about adding more. When it comes to trading systems, clarity beats complexity every single time.
What if My Backtest Results Are Bad?
First off, bad backtest results aren't a failure—they're a gift. Seriously. They're giving you incredibly valuable data, telling you that your current rules just don't have a statistical edge. Think of it as a discovery, not a setback. You've just learned what doesn't work, which is a huge step forward.
Don't scrap the entire system. Instead, go back to your rules and tweak just one variable. Change the moving average period, adjust the RSI level for your signal, or modify your risk-to-reward ratio. Then, run the test again. The goal here is to find what works through small, deliberate adjustments.
How Often Should I Change My System?
This is a big one. You absolutely have to fight the urge to tinker with your system after a couple of losing trades. Every single profitable trading system will have losing streaks. It's a statistical certainty. Your system needs time and a decent sample size—think 50-100 trades—to show you if it actually works over the long run.
Only think about making changes if you notice a major, sustained nosedive in your results. That could signal a real shift in how the market is behaving. Otherwise, sticking to your plan is your single greatest advantage. Building this discipline is tough, which is why it helps to be aware of the most common trading mistakes to avoid so you can catch yourself before you sabotage a perfectly good system.
Ready to put your simple trading system into action with professional-grade tools? OTC Charts MT4 gives you the real-time, precise data you need to execute your strategy on Pocket Option with confidence. Get instant access to our advanced charting module now!