
If you want to get serious about trading, you have to look past the number in your account balance. The real secret is to meticulously log every single trade. By analyzing key metrics, you start to see patterns you’d otherwise miss, giving you the hard data you need to actually improve. This process essentially turns your trading history into a blueprint for future success.
Why Performance Tracking Is Your Edge in the Market
So many traders ride the emotional rollercoaster. They get euphoric over wins and try to completely forget their losses, never stopping to ask why a trade worked or failed. Honestly, that's a surefire way to get inconsistent results and eventually blow up an account.
Rigorous performance tracking is what separates the disciplined pros from the hobbyists. It takes you from simply asking "Did I make money?" to understanding the specific actions that lead to profit or loss. Without that data, you're just guessing. You can’t possibly know what to change if you aren't measuring anything.
Uncovering Hidden Strengths and Weaknesses
When you keep detailed records, you start to notice things that are totally invisible in the day-to-day grind. It's fascinating what you can find.
For instance, your data might reveal that your strategy is a rockstar with major pairs like the EUR/USD but consistently bleeds money on volatile exotics. Or maybe you'll see a clear pattern: you're highly profitable during the London session but tend to give it all back around the New York open. These aren't just gut feelings; they're cold, hard facts pulled directly from your own trading.
The point of tracking isn't to beat yourself up over past mistakes. It's about figuring out the 'why' behind every single trade. That understanding is what fuels real growth and helps you manage risk like a professional.
The Foundation of Strategic Improvement
Ultimately, tracking your performance lays the groundwork for every smart decision you'll make from here on out. It gives you an objective, emotion-free look at your trading habits—both the good and the bad. Instead of panicking over a losing streak, you can see it in the context of your overall performance.
This data-first mindset allows you to make tangible improvements. You'll be able to:
- Identify profitable patterns: Find out what's truly working and do more of it.
- Pinpoint costly mistakes: Catch those recurring errors before they do any more damage to your account.
- Enhance risk management: Get a real sense of your typical drawdown, which helps you set much smarter stop-loss levels.
- Build real confidence: Your trust will be in a system proven by data, not just wishful thinking.
Think of your trading journal as your business's analytics report. A company would never try to improve its strategy without looking at sales data. Why should your trading be any different? It's the most direct path I know to becoming a more consistent, disciplined, and ultimately, profitable trader.
Of course. Here is the rewritten section with a more natural, human-written tone.
The Metrics That Truly Define Trading Success
If you want to know if your trading is actually any good, you have to look past the obvious question: "Am I making money?" The real story of your strategy's health is told through a handful of key performance metrics. These numbers dig much deeper, revealing your efficiency, how you handle risk, and your overall consistency.
Honestly, it's easy to get fixated on what I call "vanity metrics," like a high win rate. It feels great to win most of your trades, but it’s a dangerous illusion if your few losses are big enough to erase dozens of wins. What we really need to focus on are the "sanity metrics"—the numbers that give you a brutally honest look at whether your trading approach has a real future.
Key Metrics for a Complete Picture
So, what data points actually matter? These are the figures that separate a lucky streak from a genuinely robust trading strategy. Getting a handle on them is the first real step toward making meaningful improvements.
-
Profit Factor: This is the big one. It’s simply your total gross profits divided by your total gross losses. If the number is above 1.0, you're profitable. A profit factor of 2.0, for instance, means you're making twice as much money as you're losing. It's a fantastic top-level check on your system's health.
-
Maximum Drawdown: This metric measures the biggest hit your account has taken from a peak to a subsequent low. It's a stark look at risk, showing you the most painful losing streak your strategy has dished out. A massive drawdown can be psychologically crushing, even if the system is profitable overall, and it’s a red flag for excessive risk-taking.
-
Win/Loss Ratio & Average Win/Loss: This goes way beyond a simple win percentage. It compares the size of your average winning trade to your average losing trade. You're looking for a ratio over 1.0, which shows your winners are bigger than your losers. It’s entirely possible to be profitable with a low win rate, as long as your average win is a multiple of your average loss.
A trader might win 70% of the time but still bleed money if their average loss is three times their average win. On the flip side, someone winning only 40% of their trades can be incredibly profitable if their wins are consistently four or five times larger than their losses. This is why a solid risk-to-reward discipline is non-negotiable.
To give you a clearer picture, I've broken down the most important metrics in this table. Think of it as your trading dashboard—these are the dials you need to be watching constantly.
Key Trading Performance Metrics Explained
| Metric | What It Measures | Why It Is Important |
|---|---|---|
| Profit Factor | Gross profits divided by gross losses. | It's the ultimate at-a-glance measure of profitability. A value above 1 means your strategy is making money; the higher, the better. |
| Maximum Drawdown | The largest peak-to-trough decline in your account balance, shown as a percentage. | This is your gut-check for risk. It shows you the worst-case losing streak and helps you decide if you can stomach the volatility. |
| Average Win vs. Average Loss | The average dollar amount of your winning trades compared to your losing trades. | This reveals if your winners are big enough to compensate for your losers. A healthy ratio is key to long-term success. |
| Expectancy | The average amount you can expect to win or lose per trade. | It combines your win rate and your average win/loss into a single figure that tells you what each trade is worth, on average. |
| Sharpe Ratio | The measure of risk-adjusted return, comparing returns to their volatility. | This helps you understand if your returns are worth the risks you're taking. A higher Sharpe Ratio indicates better performance for the amount of risk. |
| Total Net Profit | The "bottom line"—the total money gained or lost after all trades and costs. | While important, it needs context from other metrics. A high profit with a huge drawdown might not be a good trade-off. |
By keeping these sanity metrics front and center, you shift your mindset from wishful thinking to strategic, data-driven analysis. This is the disciplined approach that separates consistently profitable traders from the rest of the crowd.
Building Your Personal Trading Dashboard
Alright, now that you know which metrics actually move the needle, it's time to build a system to track them. This isn't about finding some perfect, off-the-shelf solution. It's about creating a dashboard that fits your trading style and makes performance tracking a habit, not a chore.
You really have two solid paths you can go down here. The first is the old-school, do-it-yourself approach with a simple spreadsheet. The second is to lean on the powerful reporting tools already baked into your trading platform or a dedicated analytics service.
Crafting a Custom Trading Journal
I'm a big advocate for new traders starting with their own trading journal in Excel or Google Sheets. Why? Because it forces you to get your hands dirty with your own data. You're not just passively looking at a report; you're actively logging every decision, which really cements the lessons from each trade.
Don't overcomplicate it. Your journal just needs a few core columns to be incredibly effective:
- Date and Time: When did you get in and out?
- Asset: What did you trade? (e.g., EUR/USD, BTC/USD)
- Position Size: How much capital did you put on the line?
- Entry and Exit Price: Your exact price points.
- Strategy Used: What setup or signal made you pull the trigger?
- Profit/Loss (P/L): The bottom line, in both cash and pips.
- Mindset Notes: How were you feeling? Patient? Impulsive? Confident? Rushed?
Honestly, that last column—Mindset Notes—is often where the biggest breakthroughs happen. You might discover that your worst losses almost always come after a string of wins when you're feeling overconfident, or when you're "revenge trading" to make back a loss. To get a better feel for how this looks in practice, you can find some fantastic inspiration in these trading journal examples.
Using Built-in and Third-Party Tools
If manual data entry sounds like a total drag, don't worry. Your trading platform is sitting on a treasure trove of data. Platforms like MetaTrader 4, for instance, can generate detailed account history reports with just a few clicks. These statements automatically do the math for you, calculating things like total net profit and drawdown.
The real beauty of these reports is their brutal honesty. They give you a completely unfiltered view of your results, stripped of the emotional stories we sometimes tell ourselves.
This is what a solid dashboard looks like. You're taking raw numbers and turning them into something you can understand in a split second.
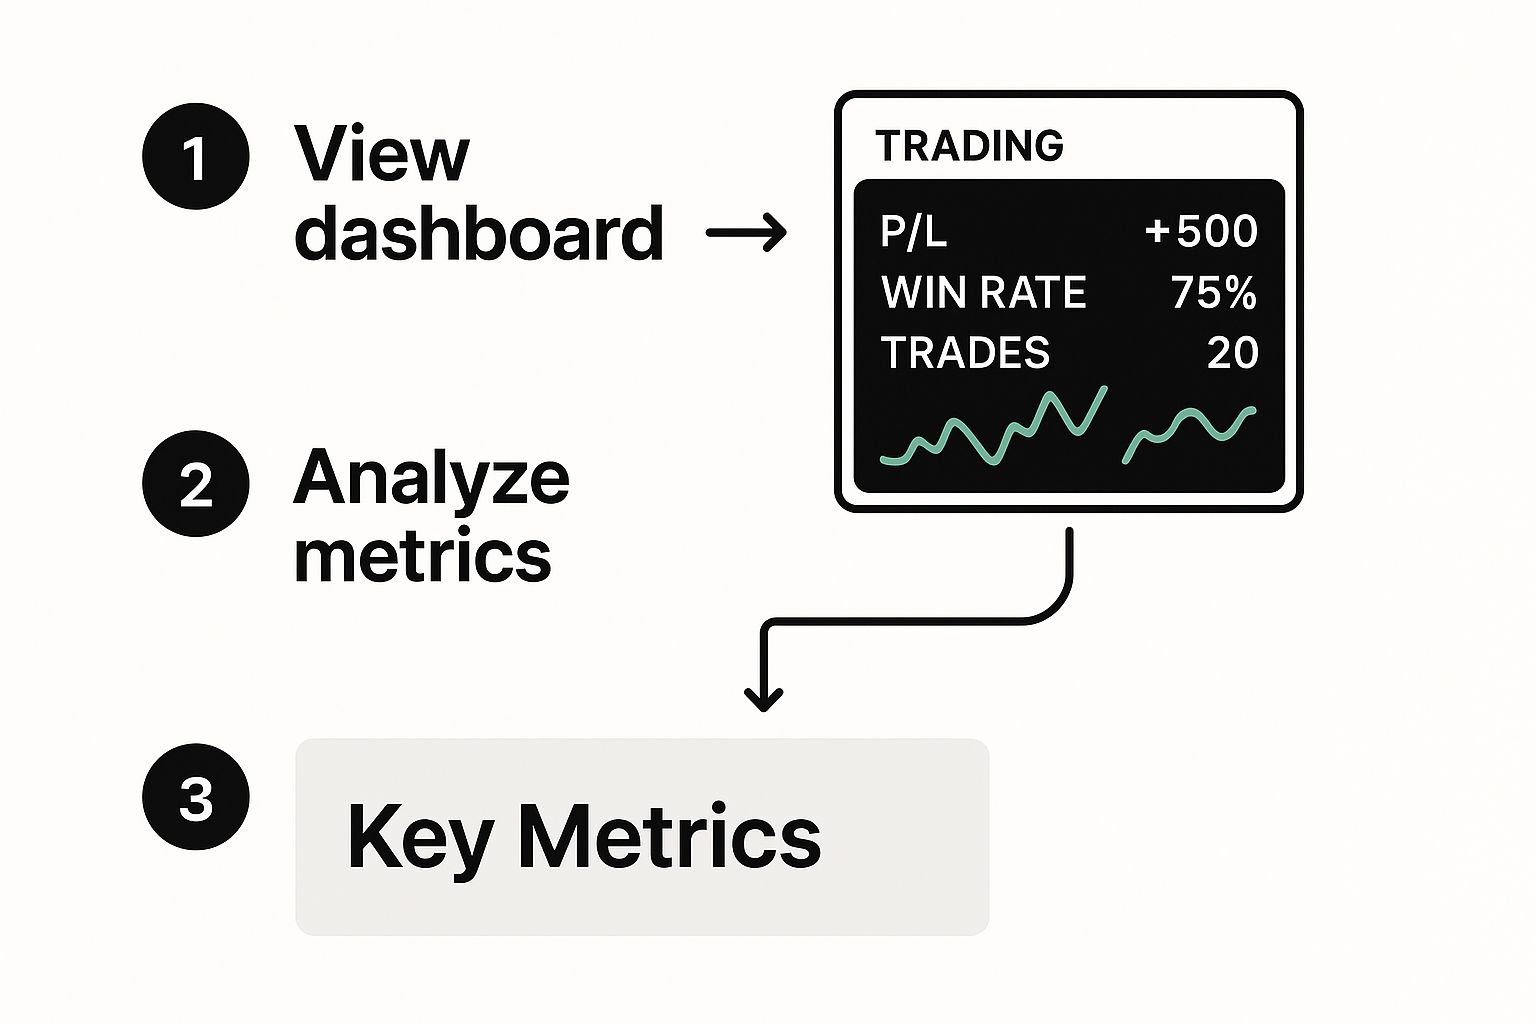
When you can see your metrics laid out visually, it’s so much easier to spot what’s working and what isn’t.
For those who want to take automation a step further, third-party analytics platforms can sync right up with your brokerage account. Tools like Tradervue or Sharesight are designed for this, offering sophisticated charting and filtering that handle all the heavy lifting. Ultimately, the choice between a DIY spreadsheet and an automated tool comes down to personal preference—do you want total control or seamless efficiency?
How to Spot Winning (and Losing) Patterns in Your Trading Data
Just collecting your trading data isn't enough. The real breakthrough comes when you start playing detective with your own performance reports, digging for answers that can genuinely reshape your trading results.
This is all about connecting the dots between your actions and your outcomes. You're looking for the clues that tell the true story of your trading habits and whether your strategy is actually working in the wild.
Slice and Dice Your Data for Killer Insights
One of the most powerful things you can do is filter your trades. Instead of viewing your entire trading history as one big, messy blob, you need to break it down. Carving it up into smaller, specific groups often shines a light on surprising strengths and weaknesses you never knew you had.
Try filtering your trades by different categories to see what patterns emerge:
- By Asset: You might discover you’re a rockstar trading major pairs like EUR/USD but consistently lose money on exotic pairs or gold. That’s a loud and clear signal to put your capital where you have a proven edge.
- By Time of Day: Are you crushing it during the high-volume London session, or do you find your groove in the quieter Asian hours? Knowing your most profitable trading times helps you show up when you're at your best.
- By Strategy or Setup: If you trade more than one setup—say, trend-following and reversals—analyze each one on its own. It's common to find that one strategy is a consistent moneymaker while another is silently bleeding your account dry.
The goal here isn't just about finding what's broken. It's equally important to identify what's working brilliantly. Once you find that sweet spot—a specific setup, asset, or time of day—your job is to figure out how to do more of it.
See How You Perform When the Market Gets Wild
Markets are always changing. Your strategy might work beautifully in a calm, trending market but fall apart completely during periods of high volatility or a big news announcement. A huge part of your analysis is understanding how your system holds up when things get chaotic.
Take the market volatility in Q2 2025, sparked by new U.S. tariff policies. The S&P 500 took an initial 12% hit, but some tech-focused growth stocks bounced back to deliver impressive 17.7% returns for the quarter. If you were tracking your performance by sector back then, you would have seen these recovery patterns firsthand. You can read a deep dive into these kinds of market dynamics from J.P. Morgan Asset Management.
This kind of analysis forces you to ask the tough questions. Does your strategy thrive on chaos, or does it crumble? Are your stop-loss levels wide enough for sudden spikes, or are you constantly getting knocked out of good trades?
By looking back at how you performed during major market events, you can build a much more resilient strategy—one designed to handle the unpredictable nature of real-world trading. This is a fundamental part of any serious plan to track trading performance.
Turning Your Trading Data Into Smarter Decisions

So, you’ve analyzed your trades and found some patterns. That's a great start, but those insights don't mean much until you act on them. This is where you connect the dots, turning raw numbers into tangible adjustments that build a powerful feedback loop for your trading. We’re moving beyond just knowing what happened to systematically improving how you'll trade tomorrow.
Let’s walk through a scenario I see all the time. A trader's report is full of small, steady wins—it feels great. But then, a handful of huge, out-of-the-blue losses come along and completely wipe out weeks of hard work.
That’s not just a string of bad luck. It's your data screaming that your risk management has a fatal flaw. The fix isn't to hope it doesn't happen again; it's to tighten your rules. You might decide to implement a non-negotiable stop-loss or simply reduce your position size on every single trade to cap the potential damage from those outlier events.
Dialing in Your Entries and Exits
Another area where data shines a light is on your timing. Maybe your numbers show your entry signals on the 1-hour chart are spot-on, but you’re consistently getting out of trades too soon and leaving most of the profit on the table. This is a clear signal to experiment with your exit strategy.
Here are a few things you could try:
- Trailing Stops: Instead of a fixed profit target, you could use a trailing stop that follows the price, letting you ride a strong trend for much longer.
- Partial Take-Profits: Try closing half of your position at your original target to lock in some gains, but let the rest run to see if it can capture a bigger move.
- Time-Based Exits: It could be that your strategy works best if you just close all open trades by the end of the day, no matter where they stand.
This kind of analysis isn't limited to your own trades; it applies to broader market trends, too. For example, back in 2025, the MSCI Emerging Markets Index showed surprising resilience despite global trade jitters, largely fueled by new tech. This is a real-world example of how tracking sector performance can uncover opportunities tied to policy changes and innovation.
The real secret here is building a constant cycle: test an idea, measure the results with cold, hard data, and then refine your rules based on what you find. This loop is what drives real, long-term growth as a trader.
Of course, before you go changing your rules and risking real money, you absolutely must validate your new approach. The best way to do that is through backtesting, which lets you simulate your refined strategy on historical data. To learn how to do this properly, take a look at our detailed guide on how to backtest trading strategies effectively.
Ultimately, you have to let the numbers be your guide. Every tweak you make—whether to your risk parameters, entry triggers, or exit rules—should be a direct response to a pattern you’ve proven with your own data. This is how you systematically track trading performance and build a strategy that’s not just based on a good idea, but on your own verified results.
Common Questions About Tracking Trading Performance
Even with a solid plan, you're bound to run into some practical questions when you start getting serious about tracking your performance. It happens to everyone. Let's walk through some of the most common hurdles to get you on the right track and build a consistent tracking habit.
How Often Should I Actually Review My Data?
This is probably the number one question I get. It’s so tempting to obsess over every single trade the second it closes, but trust me, that path often leads to emotional decision-making. You start second-guessing your strategy based on tiny, random market moves.
A much better rhythm is a weekly review. This gives you a solid batch of data to spot emerging patterns without getting bogged down by the daily noise. Then, cap it off with a monthly review to take a step back and look at the bigger strategic picture.
What Are the Best Tools for the Job?
Do you need to shell out for expensive, complicated software? For most traders, especially when you're starting out, the answer is a firm no.
Honestly, a simple spreadsheet is one of the most powerful tools you can use. Why? Because it forces you to manually engage with every single data point. That hands-on process builds a deep, intuitive understanding of your trading habits. If you find that manual entry just isn't sustainable for you, platforms like Webull can sync with various portfolio trackers to automate a lot of the work. The "best" tool is simply the one you'll actually use day in and day out.
What if My Data Is Confusing or Contradictory?
Sometimes, the numbers just don't seem to add up. You might look at your report and see a fantastic win rate—say, 65%—but your account balance is barely moving. What gives?
This is a classic scenario. It's almost always a sign that your average losses are eating up your profits. Your winning trades might be frequent, but they’re too small to make up for the handful of big losers.
When your data tells two different stories, always listen to the metrics that measure profitability and risk. Your Profit Factor and Maximum Drawdown are what really matter. A high win rate feels great, but it’s a vanity metric if a few bad trades can wipe out weeks of hard work.
Finally, let's talk about the mental game. It can be tough to look at a report filled with red. Seeing your mistakes laid out so clearly is humbling, and for some, it’s downright discouraging.
Remember why you're doing this: the goal is improvement, not judgment. The data is your coach, not your critic. This is where you have to separate your ego from the outcome and focus on the process. In fact, learning to manage these feelings is a skill in itself. Our guide on essential trading psychology tips dives deep into strategies for staying objective and building resilience when the numbers aren't what you hoped for.
Ready to elevate your analysis with professional-grade tools? OTC Charts MT4 provides the real-time, precise charting you need to make more informed decisions in the OTC markets. Get the edge you've been looking for at https://otc-charts-mt4.com.