
Trading without a journal is like navigating without a map. While many traders focus on finding the perfect indicator or strategy, the real key to consistent profitability lies in meticulous record-keeping and self-analysis. A well-maintained trading journal is more than just a log of wins and losses; it's a dynamic tool that uncovers your psychological biases, refines your strategy's edge, and reveals hidden patterns in your performance. It transforms raw trading data into a clear roadmap for improvement, pinpointing precisely what works and what doesn't.
This article dives deep into practical trading journal examples, moving beyond theory to showcase diverse, real-world methods. You will see everything from simple text logs and customized spreadsheets to sophisticated software solutions like TraderSync and Edgewonk. We will dissect each example to provide actionable insights you can apply immediately to your own trading routine.
Crucially, we'll demonstrate how integrating these journaling techniques with powerful charting tools like OTC Charts MT4 can give binary options traders a significant analytical advantage. By combining detailed journaling with precise charting, you gain a comprehensive view of your performance, enabling you to understand market movements and make truly data-driven decisions. Let's explore the templates and tactics that successful traders use to gain their edge.
1. Edgewonk Trading Journal
For traders who view their craft as a serious business, Edgewonk offers a professional-grade desktop software designed for deep performance analysis. It moves beyond simple trade logging into a comprehensive analytical suite, making it one of the most powerful trading journal examples available. It's built for those who want to dissect every aspect of their trading strategy, from psychological patterns to entry and exit efficiency.
Edgewonk integrates detailed metrics, sophisticated data visualizations, and robust analytics to help you find your "edge." It helps traders answer critical questions: Which setups yield the highest profits? Do I hold winning trades long enough? Am I cutting my losses too late? This level of detail is why it's favored by professional forex day traders and quantitative firms who require granular data to refine their strategies.
Strategic Analysis and Implementation
The core strength of Edgewonk lies in its ability to transform raw trade data into actionable insights. Instead of just recording wins and losses, it encourages you to tag trades with specific criteria like setup type, mistakes made, or market conditions. This consistent tagging builds a rich database of your unique trading behavior over time.
For example, a swing trader can create custom tags for "Breakout Confirmation" vs. "Breakout Failure" to analyze the specific conditions that lead to success or loss in their multi-week positions. The software then generates reports that visually highlight the profitability of each tag, revealing hidden strengths and weaknesses.
Key Performance Insights
The infographic below summarizes the core analytical pillars within the Edgewonk platform, focusing on performance, risk, and profit breakdowns.
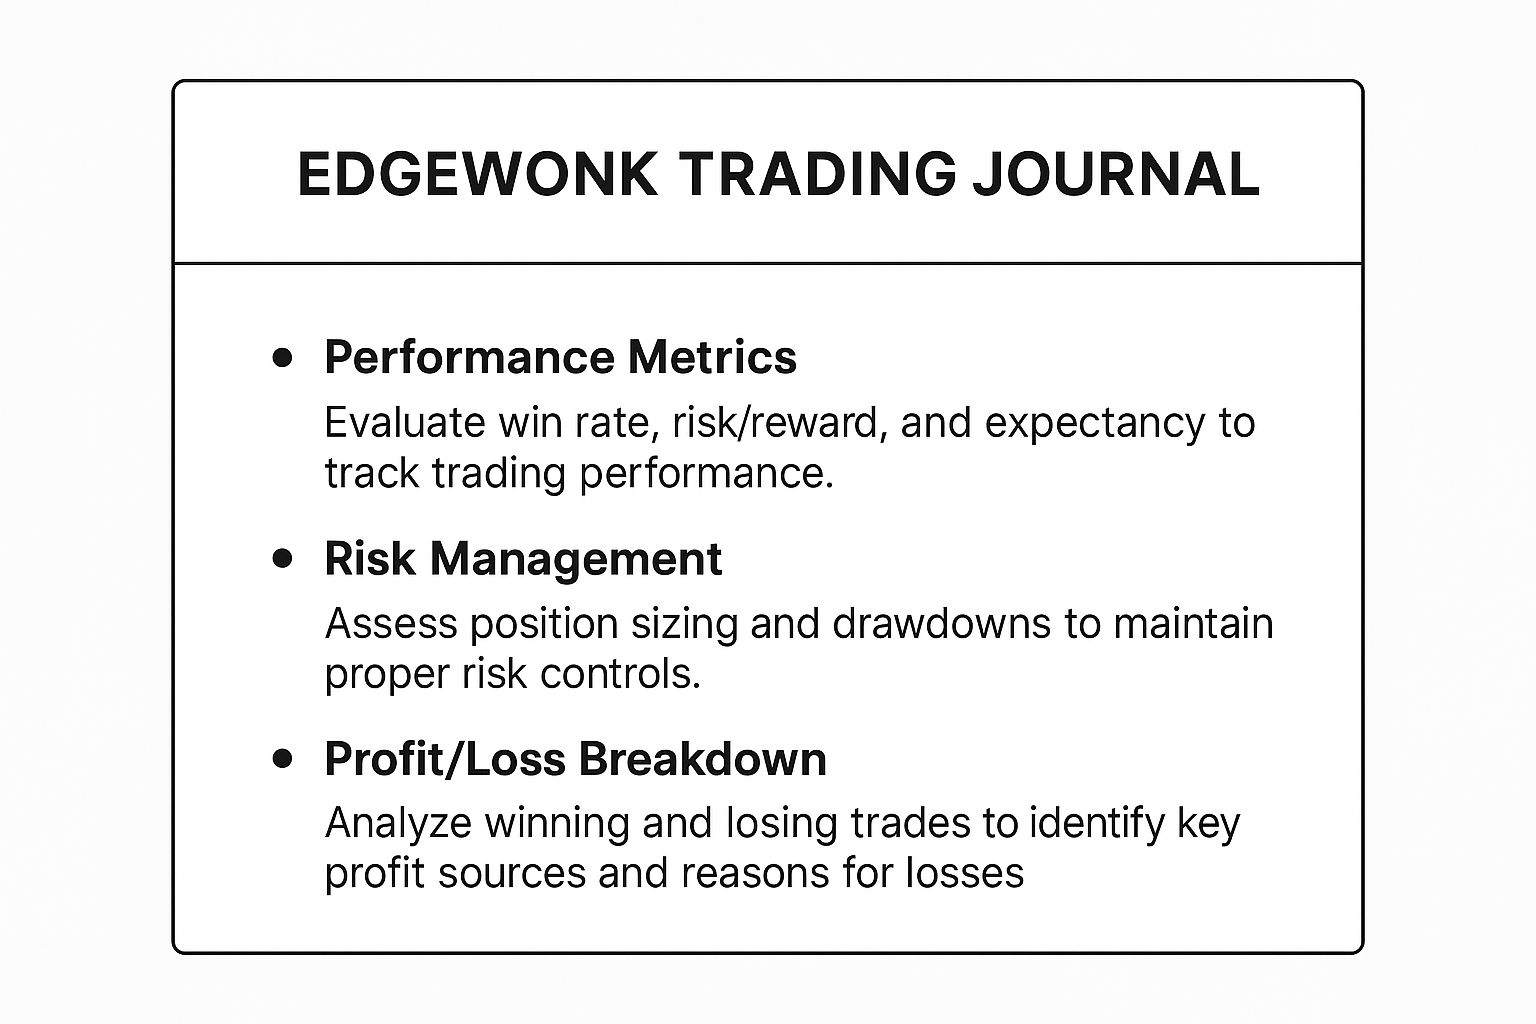
This visual breakdown highlights how Edgewonk provides a holistic view, connecting your risk management decisions directly to your profit and loss outcomes for a complete performance picture.
Actionable Takeaways
- Start Simple, Then Expand: Begin by logging basic trade data. Once comfortable, gradually introduce custom tags and explore advanced analytics like the Tilt-Meter, which measures emotional decision-making.
- Embrace Consistency: The value of Edgewonk grows with consistent data entry. Make it a non-negotiable part of your post-trading routine to ensure your analytics are accurate.
- Schedule Regular Reviews: Dedicate time weekly or monthly to review the generated reports. Look for patterns in your performance and set specific, data-driven goals for the next period.
2. TradingView Trading Journal
For traders who live on their charts, TradingView offers a uniquely integrated approach to journaling. Instead of a separate application, its features allow traders to document, analyze, and review their trades directly within the charting environment they already use for analysis. This seamless workflow makes it a favorite among retail traders who value efficiency and visual context, transforming static charts into dynamic trading journal examples.
The platform is ideal for those who think visually, allowing you to annotate your exact entry, stop-loss, and take-profit levels on the price chart itself. This method connects your trading decisions directly to the market action that prompted them. It’s particularly powerful for stock, crypto, and forex traders who rely heavily on technical analysis and want to review their trade rationale with perfect visual recall.
Strategic Analysis and Implementation
TradingView's strength is its ability to merge real-time analysis with post-trade reflection. By using its extensive drawing tools and text notes, a trader can build a living journal directly on their charts. This creates a powerful feedback loop where the "why" behind a trade is permanently linked to the "what" and "when" of its execution.
For instance, a crypto swing trader can use the "Long/Short Position" tool to visually map out their risk-to-reward ratio before entering a trade. After the trade is closed, they can add text notes detailing their emotional state, the specific candlestick pattern they acted on, and whether their thesis played out as expected. This on-chart documentation becomes invaluable during weekly reviews, providing clear, contextual evidence of strategic successes and failures.
Key Performance Insights
The primary insight from a TradingView journal is contextual. While it lacks the deep quantitative analytics of dedicated software, it excels at providing qualitative insights by answering critical questions:
- Did I follow my plan? The visual markings of entry and exit points provide undeniable evidence.
- Was my technical analysis sound? You can see precisely how the market reacted to your identified support/resistance levels or trendlines.
- How did I manage the trade in real-time? Notes can capture the reasons for moving a stop-loss or taking partial profits.
This visual-first approach is less about complex metrics and more about refining your execution and strategic discipline by linking every decision to a specific chart setup.
Actionable Takeaways
- Develop a Visual Language: Use consistent colors and tools for specific actions. For example, use green boxes for profitable trades, red for losses, and blue arrows for entry points to make your charts instantly readable.
- Leverage the Snapshot Feature: Use TradingView’s "Publish Idea" or snapshot functionality to capture your chart with all annotations. Store these images in a dedicated folder organized by date or asset for a powerful visual log.
- Combine with a Simple Spreadsheet: For quantitative analysis, pair your visual TradingView journal with a basic spreadsheet. Use the on-chart notes to fill in the qualitative data (e.g., "Reason for Entry," "Mistakes Made") alongside your P/L metrics.
3. Excel/Google Sheets Trading Journal
For traders who value ultimate control and customization, the classic Excel or Google Sheets spreadsheet remains a powerful and accessible choice. This DIY approach allows you to build a journal from the ground up, tailored precisely to your strategy, metrics, and analytical needs. It’s a foundational tool, ideal for beginners learning the ropes of trade logging and for seasoned pros who require specific, non-standard calculations.
This method transforms a simple spreadsheet into one of the most flexible trading journal examples available. By starting with a blank canvas, you have complete freedom to decide what data to track, how to visualize it, and which formulas to use for performance analysis, offering a truly personalized system.
Strategic Analysis and Implementation
The core advantage of a spreadsheet journal is its adaptability. You can structure it to mirror your trading plan, ensuring that every trade is evaluated against your predefined rules. For instance, a trader focusing on OTC markets can add custom columns for "Session Time" or "OTC Asset Type" to analyze performance during specific market hours or on particular instruments.
A professional trader might implement advanced formulas to calculate metrics like Expectancy, Profit Factor, or Maximum Adverse Excursion (MAE) directly within the sheet. This creates a dynamic dashboard that updates in real-time as new trades are logged, providing instant feedback on strategic performance. This level of customization is difficult to achieve with off-the-shelf software. Many traders use a spreadsheet to complement their formal trading plan. You can create your own custom journal using a trading plan template.
Key Performance Insights
A well-designed spreadsheet provides clear, data-driven insights at a glance. By using conditional formatting, you can make wins and losses visually distinct (e.g., green for profit, red for loss). Pivot tables and charts can then be used to summarize performance, revealing which trading setups are most profitable or which days of the week you perform best. This visual feedback loop helps reinforce good habits and quickly identify costly mistakes.
Actionable Takeaways
- Use Data Validation: Set up dropdown menus for fields like "Strategy," "Mistake Type," or "Asset" to ensure consistent data entry and prevent typos that can skew your analysis.
- Implement Conditional Formatting: Use color-coding to instantly highlight winning trades, losing trades, or trades that hit your stop-loss, allowing for rapid visual review.
- Backup Your Data: Regularly save copies of your spreadsheet to a cloud service like Google Drive or Dropbox to prevent data loss from a hardware failure or accidental deletion.
4. TraderSync Trading Journal
For the modern trader operating across multiple brokers and asset classes, TraderSync offers a dynamic, cloud-based solution that automates the tedious parts of journaling. It specializes in seamless trade importing and powerful analytics, making it a top-tier choice among trading journal examples for those who value efficiency and accessibility. This platform is built for active traders who need to consolidate data from various sources into one cohesive analytical dashboard.
TraderSync stands out by focusing on automation and deep-dive reporting. It connects directly with over 150 brokers, automatically pulling in your trade history so you can focus on analysis rather than manual data entry. This feature is particularly valuable for high-frequency day traders, options traders with complex multi-leg strategies, and forex traders managing numerous currency pairs. It's designed to give you a clear, unified view of your performance, regardless of where you execute your trades.
Strategic Analysis and Implementation
The true power of TraderSync lies in its ability to filter and evaluate your performance based on custom-defined strategies. Instead of just seeing a list of trades, you can group them by setup, mistake, or any other criteria you create. This granular tagging system helps you pinpoint exactly which strategies are working and which are draining your account.
For instance, an options trader could create tags like "Iron Condor," "Credit Spread," or "Earnings Play." Over time, the platform's reports will reveal the profit factor, win rate, and average return for each specific strategy. This data-driven feedback loop is crucial for refining your approach and doubling down on what works, a core principle that aligns well with developing a robust Pocket Option strategy.
Key Performance Insights
TraderSync provides a suite of evaluators and simulators that go beyond basic P&L tracking. Its reporting tools analyze over 40 performance metrics, including trade expectancy, profit factor, and holding times. The platform’s "What-If" simulator even allows you to see how your overall performance would change if you had avoided a specific mistake or altered your stop-loss placement, providing powerful, forward-looking insights.
This focus on cause-and-effect analysis helps traders understand the direct financial impact of their habits. By seeing a clear dollar amount associated with a repeated mistake, such as "Chasing Price" or "Exiting Too Early," you gain a tangible incentive to correct that behavior in future trades, transforming your journal from a simple log into a predictive improvement tool.
Actionable Takeaways
- Automate from Day One: Connect your broker accounts immediately to leverage TraderSync's biggest strength. This ensures your journal is always up-to-date with minimal effort.
- Develop a Tagging System: Be consistent with how you tag your trades. Create a clear, concise set of tags for your setups, mistakes, and market conditions to generate meaningful reports.
- Use the Mobile App: Leverage the TraderSync mobile app to add notes, screenshots, and emotional check-ins in real-time as you enter or exit a trade. Capturing this information in the moment is far more effective than trying to recall it later.
5. Simple Text-Based Trading Journal
For traders who prioritize psychological reflection and qualitative analysis over complex data, the simple text-based journal is a powerful and accessible tool. This minimalist method uses basic text files or note-taking apps like Notepad, Apple Notes, or Notion to document trades, thoughts, and lessons learned. It strips away the complexity of spreadsheets and software, making it one of the most direct trading journal examples for connecting with your trading mindset.
This approach is favored by traders who want to understand the "why" behind their decisions, not just the "what." It's ideal for new traders developing discipline, experienced traders supplementing quantitative data with qualitative insights, and swing traders with infrequent positions who need to capture detailed context around each decision. The focus is less on performance metrics and more on building self-awareness and refining decision-making processes.
Strategic Analysis and Implementation
The core strength of a text-based journal is its emphasis on narrative and emotional honesty. By forcing you to articulate your reasoning, emotional state, and post-trade reflections in your own words, it uncovers behavioral patterns that numerical data alone might miss. This method encourages a deep, qualitative review of your trading psychology.
For example, a day trader might notice a recurring theme of "impatience" or "fear of missing out (FOMO)" in their notes before entering losing trades. By writing down their feelings immediately after a trade, such as "I felt anxious that the price was running away, so I jumped in without waiting for my signal," they create a tangible record of their psychological triggers. Reviewing these entries weekly reveals these destructive patterns and provides a clear mandate for behavioral change.
Key Performance Insights
The power of a text-based journal lies in its simplicity and focus on qualitative learning. Instead of charts and metrics, the insights come from identifying recurring words, emotions, and rationalizations in your own writing.
A trader can structure their entries with simple, consistent headers to guide their reflection:
- Setup: Why did I consider this trade? (e.g., "Bullish flag forming on the 15-minute chart after a strong uptrend.")
- Execution: What was my entry, stop loss, and take profit?
- In-Trade Thoughts: What was I feeling while the trade was active? (e.g., "Felt nervous during the pullback, almost closed early.")
- Outcome & Lesson: What happened and what did I learn? (e.g., "The trade hit my profit target. Lesson: Trust my initial analysis and let the trade play out.")
This structured narrative format turns each trade into a case study, focusing on the lesson learned rather than just the profit or loss.
Actionable Takeaways
- Develop a Consistent Template: Use simple headings like "Setup," "Reasoning," "Emotions," and "Lesson" for every entry to ensure you capture the most important qualitative data.
- Write Immediately: Document your thoughts and feelings right after closing a trade while the experience is fresh. This prevents hindsight bias from coloring your reflection.
- Conduct Weekly Reviews: Set aside time each week to read through your entries. Look for recurring emotional words, justifications for breaking rules, and common mistakes to create focused goals for the week ahead.
6. Timetotrade Trading Journal
For traders who prioritize a seamless workflow, Timetotrade offers an integrated solution that combines trade execution, journaling, and analysis within a single platform. It eliminates the friction of using separate tools by automatically logging trades placed through its system, making it an efficient trading journal examples for those who value integration and automation. This all-in-one approach is ideal for traders who want to move from pre-trade planning to post-trade analysis without ever leaving the platform.
Timetotrade is designed to unify the entire trading process, from idea generation to performance review. With direct broker connectivity, it captures trade data in real-time, ensuring every entry, exit, and adjustment is recorded automatically. This is particularly valuable for active traders who need to maintain focus on the market rather than on manual data entry, providing an accurate and effortless foundation for strategic review.
Strategic Analysis and Implementation
The core advantage of Timetotrade is its "plan, execute, review" framework, all housed under one roof. The platform encourages traders to build a detailed trade plan before entering a position, outlining their thesis, entry and exit levels, and risk parameters. Once the trade is executed, this pre-trade plan is automatically linked to the live trade data.
For instance, a futures trader can map out a potential short position on the S&P 500 E-mini contract, specifying their entry trigger based on a key resistance level. After executing the trade via a connected broker, the journal automatically populates with the entry price, time, and size. This allows for a direct comparison between the initial plan and the actual execution, highlighting any deviations or impulsive decisions made in the heat of the moment.
Key Performance Insights
Timetotrade excels at providing a feedback loop that connects planning to performance. By analyzing the outcomes of planned versus unplanned trades, users can quickly identify whether their discipline is a source of profit or loss. The platform's analytics focus on metrics like slippage, holding time, and adherence to stop-loss targets, giving a clear picture of execution quality.
This integrated system helps traders diagnose issues like consistently moving their stop-loss or exiting profitable trades too early. The real-time risk metrics and performance dashboards offer an immediate, objective assessment of how well a trader is sticking to their strategy, which is crucial for building discipline and refining one's edge over time.
Actionable Takeaways
- Utilize Pre-Trade Planning: Always create a trade plan within Timetotrade before execution. This enforces discipline and provides a baseline for post-trade analysis.
- Leverage Automated Logging: Connect your broker to enable automatic trade syncing. This guarantees data accuracy and frees up mental capital to focus on market analysis.
- Review Real-Time Risk: Monitor the platform's risk metrics during the trading day to ensure you are staying within your predefined limits and managing your overall portfolio exposure effectively.
7. MyFXBook Trading Journal
For forex traders who thrive on community and automated analytics, MyFXBook offers a powerful web-based platform that syncs directly with your trading account. It automates the entire logging process, pulling trade data in real-time to provide sophisticated performance metrics without manual entry. This makes it an essential tool for traders who want to analyze their performance, share verified results, and connect with a global community.
MyFXBook transforms your trading history into a detailed public or private portfolio, tracking everything from profit and drawdown to risk-reward ratios. Its strength lies in its automation and social features, making it one of the most popular trading journal examples in the forex world. It is widely used by signal providers, fund managers, and retail traders who need a transparent, verified track record to build credibility or simply to hold themselves accountable.
Strategic Analysis and Implementation
MyFXBook’s core value is its ability to provide an objective, data-driven mirror of your trading habits. By linking directly to your MT4 or MT5 account, it removes the potential for emotional bias or selective reporting that can occur with manual journals. This direct connection ensures every trade, good or bad, is accounted for.
For instance, a forex trader can use the platform to publicly document their strategy for a trading competition, providing undeniable proof of their performance. The detailed analytics can help them identify patterns, such as whether they perform better on certain currency pairs or during specific trading sessions. This automated analysis is also invaluable for those looking to understand complex markets; you can find more information about navigating different market types on otc-charts-mt4.com.
Key Performance Insights
MyFXBook excels at presenting your trading statistics in a clear, digestible format. Key metrics like average win/loss, profitability by currency pair, and drawdown are automatically calculated and updated. This allows you to quickly assess the health of your trading system without spending hours crunching numbers in a spreadsheet.
The platform's ability to track your equity curve against your balance provides critical insight into your risk management. A smooth, rising equity curve indicates a sound strategy, while a volatile one might signal excessive risk-taking. This focus on verified, automated statistics ensures traders are dealing with facts, not feelings, when evaluating their strategies.
Actionable Takeaways
- Verify Your Connection: Ensure your broker account is properly connected and set to update regularly. The accuracy of your analysis depends entirely on the quality of this automated data feed.
- Use Privacy Settings: Decide early on whether your journal will be public or private. Public journals are great for building a track record, but private settings are ideal for personal review and refinement without external pressure.
- Monitor Drawdown Closely: Pay special attention to the drawdown metric. This is a critical indicator of your strategy's risk profile and can reveal weaknesses that simple profit and loss numbers might hide.
Top 7 Trading Journal Tools Comparison
| Trading Journal | 🔄 Implementation Complexity | 🛠️ Resource Requirements | 📊 Expected Outcomes | 💡 Ideal Use Cases | ⭐ Key Advantages |
|---|---|---|---|---|---|
| Edgewonk Trading Journal | High – Steep learning curve, desktop-only | Premium subscription, desktop software | In-depth performance and risk analysis | Professional and advanced traders | Detailed analytics, customizable, pro-grade reporting |
| TradingView Trading Journal | Moderate – Integrated in existing platform | Free/basic with optional subscription | Basic metrics, chart-integrated journaling | Social traders, chart-focused analysis | Seamless chart integration, community features |
| Excel/Google Sheets Journal | Moderate to High – Manual setup and formulas | Minimal cost, spreadsheet software | Fully customizable, manual analysis | Traders wanting complete data control | Highly customizable, cost-effective, familiar interface |
| TraderSync Trading Journal | Moderate – Setup with broker integrations | Subscription-based, cloud platform | Automated multi-broker import, performance | Active traders with multiple broker accounts | Automated import, multi-broker support, cloud access |
| Simple Text-Based Journal | Very Low – Basic text entry | No cost, any text editor | Qualitative insights, psychological focus | Beginners, psychology-focused traders | Extremely simple, portable, focus on psychology |
| Timetotrade Trading Journal | High – Platform-specific integration | Contact pricing, integrated platform | Real-time trade execution & analysis | Professional traders needing integrated solution | All-in-one trade execution & journaling, risk management |
| MyFXBook Trading Journal | Moderate – Forex-specific | Free/basic with subscription options | Automated forex tracking and social sharing | Forex traders wanting social features | Forex-focused, automated tracking, strong community |
Turning Your Journal into Your Greatest Trading Edge
Throughout this guide, we've dissected a diverse collection of trading journal examples, moving from the intricate automation of TraderSync and Edgewonk to the raw customizability of Excel and simple text files. Each example, whether it's the community-driven insights from TradingView or the analytical depth of MyFXBook, highlights a universal truth in trading: a journal is not merely a logbook. It is your single most powerful tool for forging a durable, profitable trading career.
The core lesson isn't about finding the single "best" journal, but about discovering the right one for your specific trading style, personality, and goals. The most advanced analytics platform is useless if its complexity prevents you from making daily entries. Conversely, a basic text file might lack the data-driven feedback you need to identify and correct costly, recurring mistakes. Your mission is to find that perfect balance.
Synthesizing the Core Lessons
The power of the trading journal examples we've explored lies in their ability to transform abstract feelings and market chaos into concrete, analyzable data. This process is the bridge between gambling and professional trading. By committing to this practice, you are actively building a personalized feedback loop that is impossible to replicate elsewhere.
Here are the critical takeaways to implement immediately:
- Consistency Over Complexity: A simple journal used every single day is infinitely more valuable than a complex one used sporadically. The habit of recording every trade, win or lose, is the foundation of your entire analytical process.
- Data-Driven Review is Non-Negotiable: Your journal's true value is unlocked during your weekly or monthly review sessions. This is where you connect the dots, identify patterns in your psychology, and pinpoint flaws in your strategy execution.
- Context is Everything: Simply noting entry and exit points is not enough. You must capture your why. Why did you take the trade? What was your emotional state? What did your technical analysis from OTC Charts MT4 indicate at that exact moment? This context turns raw data into actionable wisdom.
Your Actionable Path Forward
The journey from inconsistent results to disciplined profitability begins with a single, deliberate step. It's time to stop passively consuming information and start actively creating your own data-driven trading blueprint. Choose one of the journaling methods we've detailed, whether it's a dedicated platform or a simple spreadsheet, and commit to using it for the next 30 trades without fail.
For traders leveraging the unique opportunities of OTC markets on platforms like Pocket Option, integrating your journal with precise charting is paramount. By screenshotting your OTC Charts MT4 setup and annotating it directly within your journal entry, you create an invaluable visual record. This allows you to correlate your binary options decisions with institutional-grade technical indicators, revealing the subtle market dynamics that lead to your biggest wins and most avoidable losses. This practice elevates your review process from simple P&L tracking to a sophisticated strategic analysis, making your journal your ultimate competitive advantage.
Ready to elevate your trade analysis with professional-grade charting? Integrate the powerful analytics of OTC Charts MT4 directly into your trading journal process to gain an unparalleled view of weekend and after-hours markets. Visit OTC Charts MT4 to see how our real-time data can help you identify high-probability setups and refine your strategies with precision.