
If you're only looking at your profit and loss (P&L) statement, you're making a common—and very dangerous—mistake. Sure, it tells you if you're making or losing money, but it tells you absolutely nothing about how you're doing it. The most important trading performance metrics go far beyond simple profit, uncovering the real health, risk, and long-term sustainability of your strategy.
Why Your P&L Is Lying to You
Think of your P&L as the speedometer in your car. It’s useful for knowing your current speed, but it completely ignores the engine's temperature, how much fuel you have left, or that check engine light flashing on the dashboard. Driving by only looking at the speedometer is a recipe for disaster. Trading with only your P&L is no different. You see the immediate result but miss the critical warnings of an impending breakdown.
Successful trading isn't a game of chance or a lucky streak; it's a business, and businesses run on data. To shift from gambling to strategic investing, you have to adopt a data-driven mindset. This is where tracking a broader set of trading performance metrics becomes non-negotiable. They provide the vital context your P&L so desperately lacks.
Beyond Simple Profit and Loss
Let's imagine two traders, Alex and Ben. They both made $1,000 last month. On the surface, their performance looks identical. But when we dig into their metrics, we see a completely different story.
- Alex's Metrics: Alex scored a few huge wins but also racked up a lot of small losses. While his strategy was profitable this month, it came with a terrifying 50% maximum drawdown. At one point, his account value was literally cut in half.
- Ben's Metrics: Ben, on the other hand, booked consistent, smaller wins and kept his maximum drawdown to a very low 5%. His approach is clearly more stable and far less stressful to trade.
Without looking past the P&L, you’d never know that Alex's strategy is a high-risk roller coaster while Ben's is a model of consistency. The P&L alone lied by making them seem equal.
Trading without metrics is like flying a plane without instruments. You might be fine in clear skies, but you're completely blind once you hit turbulence. The right data is your only guide to navigating market volatility safely.
The Metrics That Tell the True Story
Key trading performance metrics act as your full instrument panel, giving you a complete, honest picture of your strategy's health. They answer the critical questions your P&L can't.
- Profit Factor: This directly answers, "For every dollar I risk, how many do I get back?" It's a raw measure of your profit-generating efficiency.
- Maximum Drawdown: This shows you the biggest hit your account has ever taken from a peak to a subsequent low. It's a crucial gauge of both financial risk and your own psychological toughness.
- Win Rate: This simply shows what percentage of your trades are profitable. It's an important number, but it can be very misleading if your few losses are big enough to wipe out dozens of small wins.
By truly understanding these numbers, you can spot problems before they turn into catastrophes. A declining Profit Factor, for instance, is a huge early warning sign that your edge in the market might be fading. This is the kind of insight that lets you make smart adjustments and protect your capital—a level of control a simple P&L statement can never give you.
Now, let's take a quick look at these essential metrics side-by-side.
Key Trading Performance Metrics at a Glance
This table summarizes the vital metrics that form the foundation of any solid trading strategy analysis. It breaks down what they measure and, more importantly, why you simply can't afford to ignore them.
| Metric | What It Measures | Why It's Critical |
|---|---|---|
| Profit Factor | The ratio of gross profits to gross losses. | It quantifies the efficiency of your strategy; a value above 1.0 is profitable, but higher is better. |
| Maximum Drawdown | The largest peak-to-trough decline in account value. | It reveals the maximum pain your strategy can inflict, gauging both risk and emotional tolerance. |
| Win Rate | The percentage of trades that close with a profit. | It provides a baseline for consistency, but must be analyzed alongside the risk/reward ratio. |
| Average Win/Loss | The average size of your winning and losing trades. | It helps you understand if your wins are substantial enough to cover your losses over time. |
Understanding these core numbers is the first step toward trading like a professional. This guide will show you exactly how to track and interpret these vital signs to make smarter, more informed decisions.
Your Foundational Trading Metrics Explained
To build a trading strategy that actually lasts, you have to move beyond the simple question, "Did I make money today?" The real pros ask smarter questions. How efficiently did I make that money? What was the financial—and emotional—cost? Was the reward really worth the risk?
Answering these questions means you have to get comfortable with the numbers that truly define your trading performance. These are your foundational trading performance metrics. Think of them as the diagnostic tools for your strategy's health. Without them, you're just flying blind in the markets.
This infographic shows how a serious trader approaches their analysis, building a professional workflow around these key numbers.
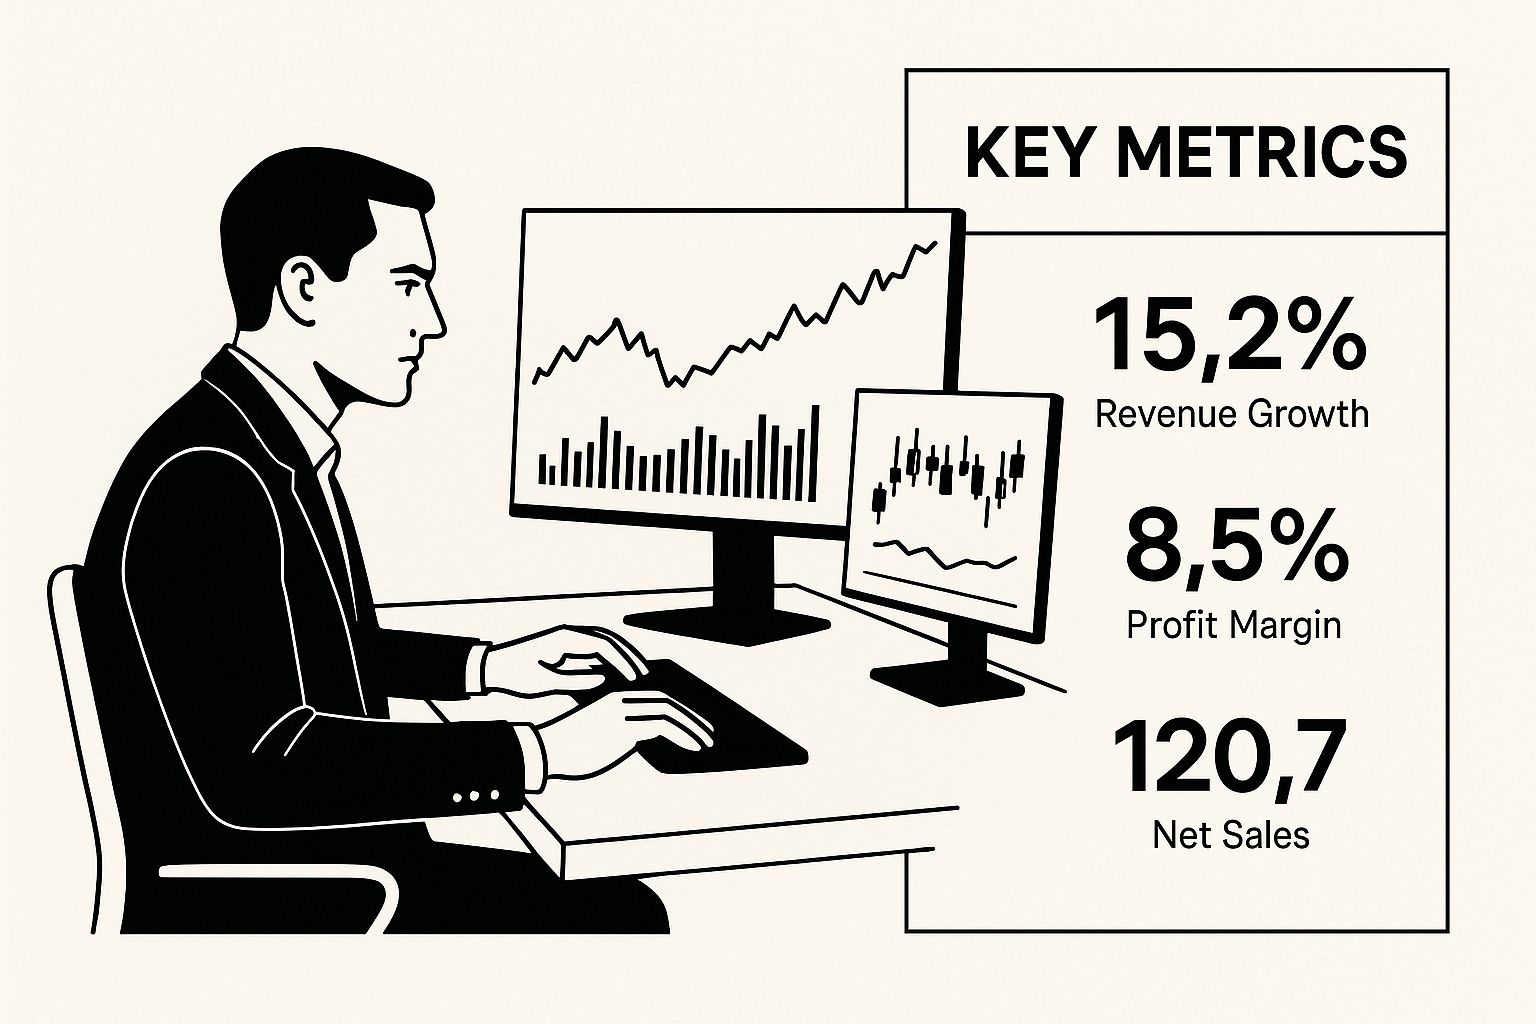
As you can see, successful trading isn’t about guesswork. It’s about systematically reviewing hard data to make informed decisions.
Profit Factor: The Efficiency Engine
The Profit Factor is one of the most powerful and direct metrics out there. It cuts straight to the point, measuring how much money your strategy makes for every single dollar it loses. It's the ultimate efficiency score for your trading.
The formula is incredibly simple:
Profit Factor = Gross Profit / Gross Loss
- A Profit Factor of 1.0 means you're just breaking even. Your wins and losses cancel each other out.
- A value below 1.0 is a red flag—you're in a losing strategy.
- A value above 1.0 shows you have a profitable system.
So, what's a good number to aim for? Generally, a Profit Factor above 1.75 is considered quite strong. If you can push it past 2.0, you've got something exceptional on your hands. It tells you that your winning trades are decisively overpowering your losers.
Maximum Drawdown: The Biggest Punch
If you ask me, Maximum Drawdown (Max DD) is the most important metric for managing risk. It measures the single largest drop your account has taken from a peak to a subsequent low. In short, it’s the biggest "punch" your portfolio has ever had to withstand.
Let's say your account grows from $10,000 to a new high of $15,000. Then, the market turns, and your balance drops to $9,000 before it starts to recover. Your maximum drawdown isn't measured from your starting balance; it's the $6,000 drop from that $15,000 peak—a painful 40% drawdown. This number is vital because it quantifies not just the financial hole you have to dig out of, but the psychological pain you must be willing to endure.
Many seasoned traders will tell you that drawdown is a deal-breaker. A strategy boasting a 20% annual return might look great on paper, but if it comes with a 40% max drawdown, most would run for the hills. They'd much rather take a strategy with a 15% return and a more manageable 10% max drawdown. You can find more great insights on this balance at Quantified Strategies.
Sharpe Ratio: Your Return Per Unit of Risk
The Sharpe Ratio helps you answer a more sophisticated question: "Are my returns actually good enough to justify the risks I'm taking?" It measures your risk-adjusted return, telling you how much extra profit you're generating for each unit of volatility (or risk) you take on.
Think of it this way: pretty much anyone can score a high return by taking on massive, stomach-churning risks. The Sharpe Ratio is what separates smart trading from reckless gambling.
A higher Sharpe Ratio is always better. It indicates you are getting more return for less volatility, which is the hallmark of a skillful and stable trading strategy. A ratio above 1.0 is generally considered good.
A strategy with lower but more consistent returns will often have a better Sharpe Ratio than a high-return, high-volatility "roller coaster" of a strategy. This makes it an invaluable tool for comparing completely different trading systems on a level playing field.
Win Rate: The Most Misleading Metric
Finally, we have the Win Rate. This one is simple: it’s the percentage of your trades that closed in profit. While having a high win rate feels fantastic, it is perhaps the most misleading metric of them all when looked at by itself.
Just look at these two traders:
- Trader A: Boasts a 90% win rate. He makes a tidy $10 on nine trades, but on his one losing trade, he loses $100. His net result is a -$10 loss.
- Trader B: Has a much less impressive 40% win rate. She loses $20 on six trades but makes $50 on her four winners. Her net result is an $80 profit.
Who’s the better trader? It’s not even close—it's Trader B. This example is the perfect illustration of why focusing only on your win rate is so dangerous. A high win rate is completely meaningless if your few losses are big enough to wipe out all those small gains. You must always analyze your win rate alongside your average win and average loss to get the complete, honest picture of your performance.
How to Stress-Test Your Strategy with Historical Data
A profitable strategy on paper is just an idea. A strategy that has survived the brutal tests of history? That's a potential goldmine.
This is where backtesting comes in—it’s like having a trading time machine. By pitting your system against past market data, you can see how it would have performed through crashes, rallies, and those painfully quiet periods. It’s a powerful preview of your strategy's true strengths and weaknesses.
Backtesting is what turns a promising concept into a battle-tested plan. It’s the process of rigorously applying your entry and exit rules to historical price data to simulate how your strategy would have fared. This isn't about predicting the future with perfect accuracy; it's about building confidence and finding your system's breaking points before you risk a single dollar of real capital.
Simulating Real-World Conditions
To be useful, your simulation has to be as realistic as possible. This means you must account for the little details that eat into profits, like spreads, commissions, and potential slippage. A basic backtest might look great, but once you factor in these real-world costs, a marginally profitable strategy can quickly slip into the red.
A thorough backtest should cover a long stretch of time, ideally one that includes different market environments. Did your strategy make it through the 2008 financial crisis? How did it handle the whiplash volatility of 2020? Seeing how your trading performance metrics hold up under extreme stress is invaluable.
The point of backtesting isn't to find a "perfect" strategy that never loses. It's to understand the character of your strategy—its typical drawdown, its profit potential, and its resilience—so you aren't shocked when it behaves the same way in a live market.
Uncovering Seasonal Patterns and Tendencies
Beyond just surviving major crises, historical data can reveal subtle but powerful patterns. For example, some traders analyze years of data from a platform like Bookmap.com to spot recurring trends, like certain retail stocks getting a boost during the holiday shopping season. This insight allows them to plan entries and exits more strategically to capitalize on predictable market behaviors.
This kind of deep analysis helps you ask much sharper questions about your strategy:
- Does my system perform better during certain months of the year?
- Is it more effective during the London session versus the New York session?
- Does it thrive in high-volatility environments, or does it fall apart?
Answering these questions allows you to fine-tune your approach. Maybe you'll decide to only trade your system during its optimal hours or to sit on the sidelines during periods where it historically underperforms.
Advanced Backtesting Metrics: MAE and MFE
To get an even deeper layer of understanding, professional traders often turn to metrics like Maximum Adverse Excursion (MAE) and Maximum Favorable Excursion (MFE).
-
Maximum Adverse Excursion (MAE): This measures the biggest loss a trade experienced from its entry point before being closed. Think of it as the maximum "pain" or drawdown each individual trade put you through. A high MAE on your winning trades could be a clue that your stop-loss is too wide.
-
Maximum Favorable Excursion (MFE): This measures the highest peak profit a trade reached from its entry. If your average profit is way lower than your average MFE, it’s a huge red flag that you're closing winning trades too early and leaving a lot of money on the table.
Analyzing these two metrics together gives you critical feedback for optimizing your stop-loss placement and take-profit targets, letting you fine-tune the very mechanics of your system. If this sounds like a process you want to master, check out our detailed guide on how to backtest trading strategies effectively. This systematic approach is what separates the amateurs from the pros.
Looking back at historical data is a great way to build a foundation, but the real test for any trader is what happens in the heat of the moment. This is where real-time monitoring becomes your secret weapon, turning abstract trading performance metrics from old reports into live, actionable data that can inform your decisions right now. It's all about making objective, data-driven moves while a trade is active, not just picking it apart in hindsight.
Let's bridge the gap between theory and practice. A tool like OTC Charts for MT4 lets you graduate from backtesting to live analysis, giving you a constant pulse on your strategy's health. This is what helps you stick to your plan and avoid those gut-wrenching emotional mistakes when your live performance starts to veer off course from its historical baseline.
Setting Up Your Performance Dashboard
Getting your real-time tracking up and running is surprisingly simple. Once you've hooked OTC Charts into your MT4 platform, you gain access to a dedicated performance panel that updates with every single trade you make. This isn't some static report you pull at the end of the week; it's a living, breathing dashboard that shows your equity curve, profit factor, and other crucial numbers as they happen.
The whole point is to have your most critical metrics visible at a glance. Think of it like a pilot's cockpit—you need instant readouts on your altitude (equity), engine performance (profit factor), and system warnings (drawdown) to navigate the market skies safely.
This screenshot shows a perfect example of a clean dashboard that gives you a clear visual summary of your live trading.
This kind of immediate visual feedback is incredibly powerful. It keeps you disciplined and helps you instantly recognize when your live results are drifting away from what your backtests told you to expect.
Monitoring Key Metrics Live
With your dashboard active, you're now watching your strategy's vital signs in real time. Here are a few practical ways to use this live data to stay ahead.
-
Live Equity Curve: You can literally watch your account balance grow (or shrink) trade-by-trade. Ideally, you want to see a smooth, upward-sloping curve. If it starts getting choppy or takes a nosedive, that’s your first and most obvious signal to go back and review what's happening.
-
Profit Factor Alerts: Is your Profit Factor staying above that all-important 1.75 mark you aimed for? With a live tracker, you can see this number fluctuate. Watching it drop from a healthy 2.1 to 1.5 after a few bad trades is a stark, objective warning that the current market conditions might not be a good fit for your strategy anymore.
-
Real-Time Drawdown Checks: Let’s say your backtesting showed a historical max drawdown of 15%. If you see your live drawdown creeping up to 12% or 13%, that's a critical moment. It's a heads-up that allows you to tighten your risk or even pause trading before you breach a level that could cause serious financial and psychological pain.
Monitoring performance isn't about nervously watching every tick. It's about building an objective feedback loop that keeps you honest and holds you accountable to the rules you set in your trading plan.
To keep improving, you need to dissect your approach with hard data. For instance, knowing your win rate—the percentage of profitable trades—is useful, but it’s even better when paired with your average profit/loss ratio. A trader with a modest 55% win rate can be consistently profitable if their average winning trade is twice as large as their average losing trade. Systematically tracking these numbers reveals which strategies actually work and under what conditions. You can find more great insights on how to track trading performance on TradeFundrr.
This continuous feedback loop is what separates the pros from the amateurs. Instead of waiting until the end of the month to realize something is broken, you can spot a negative trend in hours or days. That agility is what will help you survive and thrive in the markets long-term.
Turning Your Trading Data Into Actionable Insights
Collecting data on your trades is one thing. Actually using that data to make smarter, more profitable decisions? That’s where the real magic happens. This is the leap from just keeping score to becoming a true strategist, turning your trading journal from a simple logbook into a roadmap for getting better every single day.

The trick is learning how to connect the dots between your various trading performance metrics. Looking at one number in a vacuum can give you a completely wrong impression. The real insights come when you see how they all work together and the story they tell as a whole.
Decoding the Story Your Metrics Tell
Let's walk through a few common scenarios. Think of this as learning to understand the market's feedback on your personal strategy.
Imagine a trader with a fantastic 80% win rate. Sounds great, right? But their account balance is barely budging. A quick look at their profit factor reveals a disappointing 1.1. This is a massive red flag. It tells us that while they’re winning most of the time, the few losses they take are huge, wiping out all the hard work from dozens of smaller wins.
What does this pattern tell us? It often points to a psychological hang-up: cutting winning trades short out of fear, while letting losers run wild, hoping they'll miraculously turn around. The data gives a clear command: work on letting winners run and always, always respect your stop-loss.
Creating an If-Then Framework for Action
To make your data genuinely useful, you need to build a simple "if-then" framework. This is just a set of pre-planned rules that tell you exactly what to do when your live performance starts to drift away from what your backtesting showed.
This framework is your defense against making emotional decisions in the heat of the moment.
- IF my live drawdown hits 75% of my backtested maximum drawdown, THEN I will immediately cut my position size in half for the next 10 trades.
- IF my profit factor dips below 1.5 over a 20-trade period, THEN I will stop live trading and reassess if the current market still fits my strategy.
- IF my average losing trade gets bigger than my average winning trade, THEN I will do a deep dive into my last 30 trades to figure out what's gone wrong with my risk-to-reward.
This kind of structured approach forces you to act on statistical proof, not just a gut feeling. It's the system that protects your trading capital from your own human emotions and builds long-term discipline.
Segmenting Performance to Uncover Hidden Edges
The best traders I know take their analysis one step further. They segment their performance data. Your overall metrics give you the big picture, but slicing that data into smaller chunks can reveal your hidden strengths and critical weaknesses.
Start breaking down your results to answer more detailed questions. You’ll be surprised by the patterns you uncover.
Performance by Asset
Do you crush it when trading EUR/USD but constantly lose money on Gold? The data might be telling you that your strategy thrives in low-volatility forex pairs but falls apart in trending commodity markets. This insight is pure gold—it tells you to focus your capital where you have a proven edge.
Performance by Time of Day
Maybe you notice that most of your profits come during the London session, but the New York open is a consistent money pit. Many traders find their strategy only really sings during specific market conditions tied to session liquidity. Segmenting by time helps you pinpoint your most profitable trading hours.
This deep level of analysis takes your trading from a "one-size-fits-all" gamble to a highly specialized, professional operation. For anyone looking to get this granular, we have a complete guide that will help you track trading performance with this kind of precision. By identifying exactly where you shine, you can double down on your strengths and start cutting out your weaknesses for good.
Common Mistakes to Avoid in Performance Tracking
Getting your hands on detailed performance data is a huge step forward, but let's be honest—data is just noise if you don't know how to read it correctly. I've seen countless traders fall into the same old traps, creating a false sense of security that leads straight to bad decisions and losses that could have been avoided.
Knowing what not to do is just as important as knowing which metrics to track.
One of the biggest pitfalls is obsessing over vanity metrics. A high win rate, for instance, feels fantastic on the surface. But as we've already covered, it can easily mask a few disastrously large losses that wipe out all those small wins and then some. Focusing only on your win percentage without also looking at your profit factor or average risk-to-reward ratio is a classic rookie move. Think of it like a basketball player who makes lots of easy layups but gives up even more three-pointers—it looks good until you check the final score.
Ignoring the Hidden Costs
Another mistake that can quietly drain your account is failing to account for the "invisible" costs of trading. Every single time you place a trade, there are small drags on your performance that add up much faster than you might think.
- Commissions and Fees: These are the most obvious ones—direct deductions from your profits or additions to your losses on every trade.
- Slippage: This is the subtle difference between the price you thought you'd get and the price you actually got. When the market is moving quickly, even a few pips of slippage can turn a winner into a loser.
If you ignore these real-world costs, you're looking at your strategy through rose-colored glasses. A system that looks fantastic on paper can quickly start losing money once you factor in the realities of a live trading environment.
A particularly dangerous trap is ‘curve-fitting’—over-optimizing a strategy on historical data until it looks perfect. It's the art of making a strategy flawless in hindsight, but it almost always fails in live markets because it was designed to fit past noise, not a genuine, repeatable edge.
The key is to stay objective and brutally honest in your analysis. To go even deeper on this topic, check out our guide on the most common trading mistakes to avoid for more insights that can help protect your capital.
Common Questions on Trading Metrics Answered
Once you start getting serious about tracking your performance, the theoretical stuff gives way to practical, real-world questions. This is where the rubber meets the road. Let's dig into some of the most common hurdles traders face when they begin to analyze their own data.
Getting these answers right is crucial. It's how you move from just having a strategy to actually refining it, setting realistic goals, and building a solid routine for checking your progress.
What’s a “Good” Sharpe Ratio for a Regular Trader?
This question comes up all the time, and honestly, the answer isn't as simple as you'd hope. Big institutional funds are obsessed with high Sharpe Ratios to show off to investors, but for a retail trader, the game is a bit different.
As a general rule of thumb, a Sharpe Ratio above 1.0 is pretty solid. It means the returns you're getting are higher than the risk you're taking on. If you see your ratio climbing toward 2.0, you're doing exceptionally well.
But remember, context is king. A high-frequency scalping strategy might naturally have a lower Sharpe Ratio than a slow-and-steady trend-following system, yet it could be just as profitable. The key isn't to fixate on a single number but to compare your live Sharpe Ratio to the one from your backtests. That tells you if you're staying on track.
How Many Trades Do I Need for the Data to Mean Anything?
It's one of the biggest rookie mistakes: making huge decisions based on a tiny handful of trades. Sure, a 10-trade winning streak feels amazing, but statistically, it doesn't prove much.
Most pros and statisticians will tell you that you need at least 30 to 50 trades just to get a baseline reading where your metrics start to mean something.
If you want real confidence in your numbers, aim for 100 trades or more. A larger sample size like this helps filter out the noise of pure luck and gives you a much clearer, more reliable picture of your strategy's actual edge.
Pips, Percentages, or Dollars: What’s Best for Tracking?
Each of these has its place, but if your goal is to analyze your strategy's performance objectively, then tracking in percentages or pips/points is the way to go.
- Currency ($): Watching your account balance grow is motivating, no doubt. But it can also fool you. A $100 profit on a $1,000 account is a massive 10% win, while that same $100 on a $50,000 account is a tiny 0.2% gain.
- Pips/Points: This is perfect for judging your pure skill at calling market direction. It completely strips out position size, so you're only measuring the raw effectiveness of your entry and exit signals.
- Percentage (%): This is probably the best all-around metric. It standardizes your performance, making it simple to compare results from week to week or month to month, even if your account size and trade sizes are changing.
How Often Should I Actually Review My Stats?
Finding the right rhythm for performance reviews is a balancing act. Analyze too often, and you'll drive yourself crazy, making emotional tweaks based on every little dip. Analyze too little, and you could miss a serious problem until it's too late.
A tiered schedule usually works best:
- Daily: A quick, 5-minute glance just to make sure you didn't break any major rules and that everything is running as expected.
- Weekly: A proper sit-down to look at the week's key numbers, like your Profit Factor and Win Rate. This is where you can spot short-term trends.
- Monthly/Quarterly: The deep dive. This is when you pull up all your metrics and compare them to your long-term history to check the overall health and consistency of your trading.
Ready to stop guessing and start measuring? OTC Charts MT4 provides the real-time dashboard you need to track these critical metrics live, turning raw data into actionable insights that sharpen your edge. Elevate your Pocket Option trading strategy today.